. 2003 Sep;85(3):1974-9.
doi: 10.1016/S0006-3495(03)74625-6.

Multiplexed DNA quantification by spectroscopic shift of two microsphere cavities

Affiliations

Multiplexed DNA quantification by spectroscopic shift of two microsphere cavities

Frank Vollmer et al. Biophys J. 2003 Sep.

Abstract

We have developed a novel, spectroscopic technique for high-sensitivity, label-free DNA quantification. We demonstrate that an optical resonance (whispering gallery mode) excited in a micron-sized silica sphere can be used to detect and measure nucleic acids. The surface of the silica sphere is chemically modified with oligonucleotides. We show that hybridization to the target DNA leads to a red shift of the optical resonance wavelength. The sensitivity of this resonant technique is measured as 6 pg/mm(2) mass loading, higher as compared to most optical single-pass devices such as surface plasmon resonance biosensors. Furthermore, we show that each microsphere can be identified by its unique resonance wavelength. Specific, multiplexed DNA detection is demonstrated by using two microspheres. The multiplexed signal from two microspheres allows us to discriminate a single nucleotide mismatch in an 11-mer oligonucleotide with a high signal-to-noise ratio of 54. This all-photonic whispering gallery mode biosensor can be integrated on a semiconductor chip that makes it an easy to manufacture, analytic component for a portable, robust lab-on-a-chip device.


Figures

FIGURE 1
FIGURE 1
Experimental setup. (A) Light from a laser diode is transmitted through a single-mode optical fiber, F. Two silica microspheres, S1 and S2, are evanescently coupled to the fiber. A photodetector, P, records the intensity at the other fiber end. Optical resonances (WGMs) from each sphere are identified as Lorentzian-shaped dips in the transmission spectrum. Each sphere, S1 and S2, is modified with a different oligonucleotide of interest. The hybridization event of the complementary, label-free oligonucleotide on sphere S1 is detected in real time with millisecond time resolution by an increase of the S1-specific resonance wavelength. This leads to a shift of the S1-specific resonance position (red line). (B) Micrograph of two spheres coupled to the optical fiber running horizontally through the center of the image. The image shows two resonances of light orbiting inside each sphere.
FIGURE 2
FIGURE 2
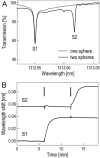
Multiplexed DNA detection. (A) Transmission spectrum for one (dotted line) and two (solid line) spheres coupled to the same optical fiber, immersed in a PBS solution at room temperature. Both spheres are ∼200 μm in radius. The narrow infrared spectrum ranging from 1312.92 to 1313.06 nm is recorded every 10 ms. The position of the resonance wavelengths from each of the spheres, S1 and S2, is located by a parabolic minimum fit in a resolution of ∼1/50 of the linewidth, allowing detection of a fractional wavelength change δλ/λ as small as ∼3 × 10⁻⁷. Both spheres were modified with unrelated, 27-mer oligonucleotides: S1 with 5′-biotin-TATGAATTCAATCCGTCGAGCAGAGTT, S2 with 5′-biotin-ATTAATACGACTCACTATAGGGCGATG. (B) Shows the time trace of the two resonance positions from S1 and S2. The arrows indicate when the two complementary DNA oligonucleotides are injected into the sample solution to a final concentration of 1 μM each. Hybridization saturates within minutes and the resonance wavelength of the corresponding sphere increased ∼0.038 nm each. The noise before adding the complementary DNA was only ∼0.04 × 10⁻³ nm.
FIGURE 3
FIGURE 3
Optimal monovalent salt concentration for mismatch discrimination. Microspheres were modified with an 11-mer oligonucleotide (5′-biotin-CTATCTCAGTC). Equilibrium resonance wavelength shifts were recorded after hybridization to the perfect match and to the 1 bp mismatch sequence (3′-GATATAGTCAG) at different NaCl concentrations. The fractional wavelength shift (normalized to the maximum shift at high salt concentrations) for the matching sequence is ∼10 times larger as compared to the mismatch sequence for an optimal NaCl concentration of ∼30 mM. Experiments were performed at room temperature in a 20 mM Tris buffer pH 7.4.
FIGURE 4
FIGURE 4
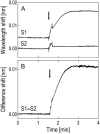
Single nucleotide mismatch detection. (A) Time traces of resonance wavelengths in two spheres, S1 and S2. S1 was modified with a biotinylated 11-mer oligonucleotide (5′-biotin-CTATCTCAGTC). The oligonucleotide immobilized on S2 differed by a single nucleotide (5′-biotin-CTATATCAGTC). The arrow indicates when the oligonucleotide complementary to the sequence immobilized on sphere S1 is injected to a final concentration of 1 μM. In equilibrium, the wavelength shift for the perfect match sequence is ∼10 times as large as the shift for mismatch sequence. (B) The difference signal allows one to identify a single nucleotide mismatch with a high signal-to-noise ratio of 54. Spikes due to transient temperature and refractive index fluctuations after injection and mixing are eliminated in the difference signal compared to the individual wavelength trace from each sphere.

Similar articles

Cited by

References

    1. Anderson, R. C., X. Su, G. J. Bogdan, and J. Fenton. 2000. A miniature integrated device for automated multistep genetic assays. Nucleic Acids Res. 28:E60. - PMC - PubMed
    1. Armani, D. K., T. J. Kippenberg, S. M. Spillane, and K. J. Vahala. 2003. Ultra-high-Q toroid microcavity on a chip. Nature. 421:925–928. - PubMed
    1. Arnold, S., M. Khoshsima, I. Teraoka, S. Holler, and F. Vollmer. 2003. Shift of whispering gallery modes in microspheres by protein adsorption. Opt. Lett. 28:272–274. - PubMed
    1. Baird, C. L., and D. G. Myszka. 2001. Current and emerging commercial optical biosensors. J. Mol. Recognit. 14:261–268. - PubMed
    1. Bates, P. J., J. F. Reddoch, P. Hansakul, A. Arrow, R. Dale, and D. M. Miller. 2002. Biosensor detection of triplex formation by modified oligonucleotides. Anal. Biochem. 307:235–243. - PubMed

Publication types