

Charge displacements during ATP-hydrolysis and synthesis of the Na+-transporting FoF1-ATPase of Ilyobacter tartaricus
- PMID: 12944317
- PMCID: PMC1303376
- DOI: 10.1016/S0006-3495(03)74632-3
Charge displacements during ATP-hydrolysis and synthesis of the Na+-transporting FoF1-ATPase of Ilyobacter tartaricus
Abstract
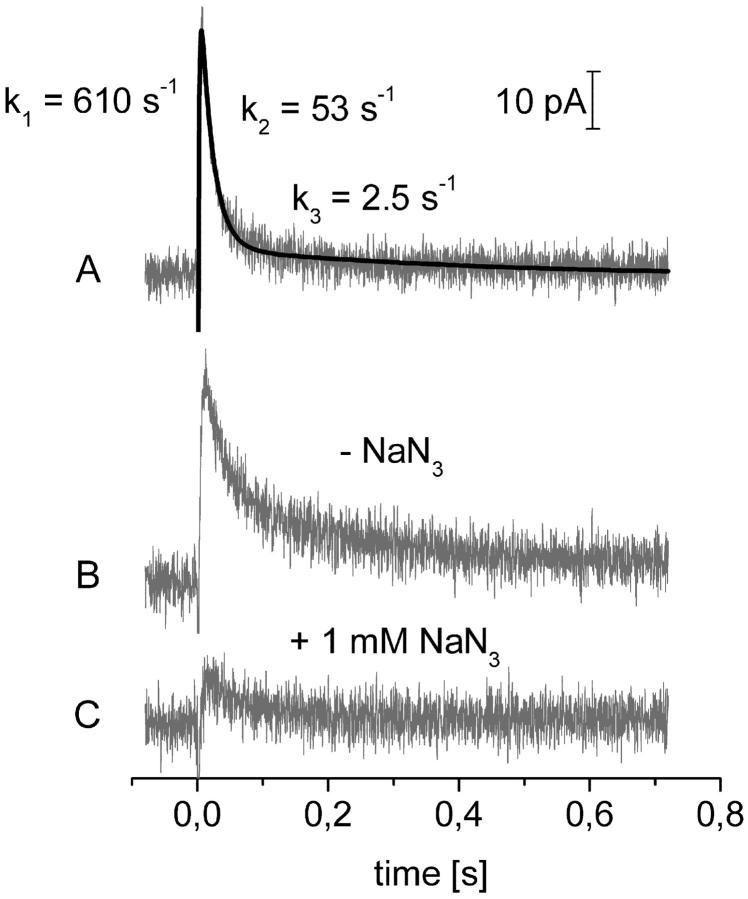
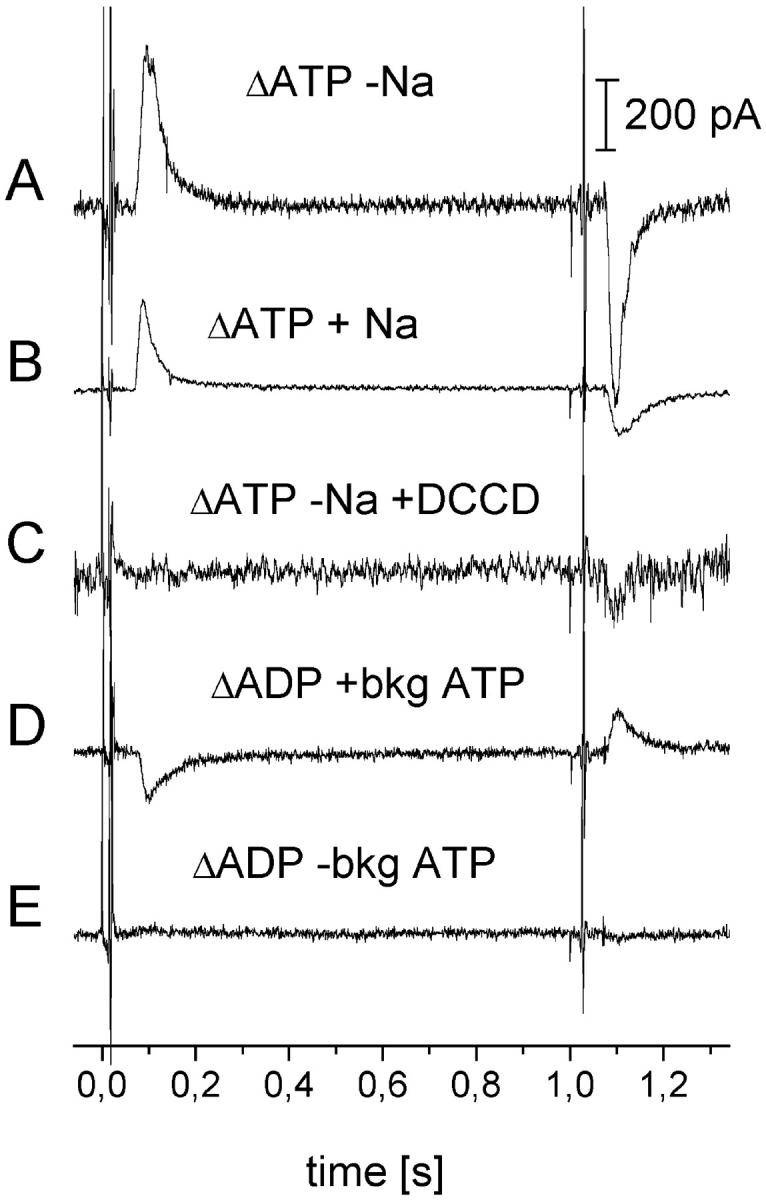
Transient electrical currents generated by the Na(+)-transporting F(o)F(1)-ATPase of Ilyobacter tartaricus were observed in the hydrolytic and synthetic mode of the enzyme. Two techniques were applied: a photochemical ATP concentration jump on a planar lipid membrane and a rapid solution exchange on a solid supported membrane. We have identified an electrogenic reaction in the reaction cycle of the F(o)F(1)-ATPase that is related to the translocation of the cation through the membrane bound F(o) subcomplex of the ATPase. In addition, we have determined rate constants for the process: For ATP hydrolysis this reaction has a rate constant of 15-30 s(-1) if H(+) is transported and 30-60 s(-1) if Na(+) is transported. For ATP synthesis the rate constant is 50-70 s(-1).
Figures


Similar articles
-
Purification and Reconstitution of Ilyobacter tartaricus ATP Synthase.Methods Mol Biol. 2018;1805:51-71. doi: 10.1007/978-1-4939-8556-2_3. Methods Mol Biol. 2018. PMID: 29971712
-
Structure of the rotor ring of F-Type Na+-ATPase from Ilyobacter tartaricus.Science. 2005 Apr 29;308(5722):659-62. doi: 10.1126/science.1111199. Science. 2005. PMID: 15860619
-
Two distinct proton binding sites in the ATP synthase family.Biochemistry. 2007 Oct 23;46(42):11800-9. doi: 10.1021/bi701083v. Epub 2007 Oct 2. Biochemistry. 2007. PMID: 17910472
-
The Na(+) cycle in Acetobacterium woodii: identification and characterization of a Na(+) translocating F(1)F(0)-ATPase with a mixed oligomer of 8 and 16 kDa proteolipids.Biochim Biophys Acta. 2001 May 1;1505(1):108-20. doi: 10.1016/s0005-2728(00)00281-4. Biochim Biophys Acta. 2001. PMID: 11248193 Review.
-
Charge transfer in P-type ATPases investigated on planar membranes.Arch Biochem Biophys. 2008 Aug 1;476(1):75-86. doi: 10.1016/j.abb.2008.02.031. Epub 2008 Feb 29. Arch Biochem Biophys. 2008. PMID: 18328799 Review.
Cited by
-
Arrayed lipid bilayer chambers allow single-molecule analysis of membrane transporter activity.Nat Commun. 2014 Jul 24;5:4519. doi: 10.1038/ncomms5519. Nat Commun. 2014. PMID: 25058452 Free PMC article.
-
Modified nucleoside triphosphates in bacterial research for in vitro and live-cell applications.RSC Chem Biol. 2020 Dec 1;1(5):333-351. doi: 10.1039/d0cb00078g. Epub 2020 Sep 14. RSC Chem Biol. 2020. PMID: 33928252 Free PMC article.
-
Measuring ion channels on solid supported membranes.Biophys J. 2009 Jul 8;97(1):388-96. doi: 10.1016/j.bpj.2009.04.022. Biophys J. 2009. PMID: 19580777 Free PMC article.
-
Rapid substrate-induced charge movements of the GABA transporter GAT1.Biophys J. 2005 Jul;89(1):211-31. doi: 10.1529/biophysj.105.061002. Epub 2005 Apr 22. Biophys J. 2005. PMID: 15849242 Free PMC article.
-
Concentration gradient effects of sodium and lithium ions and deuterium isotope effects on the activities of H+-ATP synthase from chloroplasts.Biophys J. 2009 Mar 18;96(6):2479-89. doi: 10.1016/j.bpj.2008.12.3910. Biophys J. 2009. PMID: 19289072 Free PMC article.
References
-
- Abrahams, J. P., A. G. Leslie, R. Lutter, and J. E. Walker. 1994. Structure at 2.8 A resolution of F1-ATPase from bovine heart mitochondria. Nature. 370:621–628. - PubMed
-
- Al-Shawi, M. K., C. J. Ketchum, and R. K. Nakamoto. 1997. The Escherichia coli FOF1 γM23K uncoupling mutant has a higher K0.5 for Pi. Transition state analysis of this mutant and others reveals that synthesis and hydrolysis utilize the same kinetic pathway. Biochemistry. 36:12961–12969. - PubMed
-
- Bamberg, E., H. J. Butt, A. Eisenrauch, and K. Fendler. 1993. Charge transport of ion pumps on lipid bilayer membranes. Q. Rev. Biophys. 26:1–25. - PubMed
-
- Bianchet, M. A., P. L. Pedersen, and L. M. Amzel. 2000. Notes on the mechanism of ATP synthesis. J. Bioenerg. Biomembr. 32:517–521. - PubMed
Publication types
MeSH terms
Substances
LinkOut - more resources
Full Text Sources
Molecular Biology Databases
