

Brownian dynamics simulations of the interaction of Chlamydomonas cytochrome f with plastocyanin and cytochrome c6
- PMID: 12944318
- PMCID: PMC1303377
- DOI: 10.1016/S0006-3495(03)74633-5
Brownian dynamics simulations of the interaction of Chlamydomonas cytochrome f with plastocyanin and cytochrome c6
Abstract
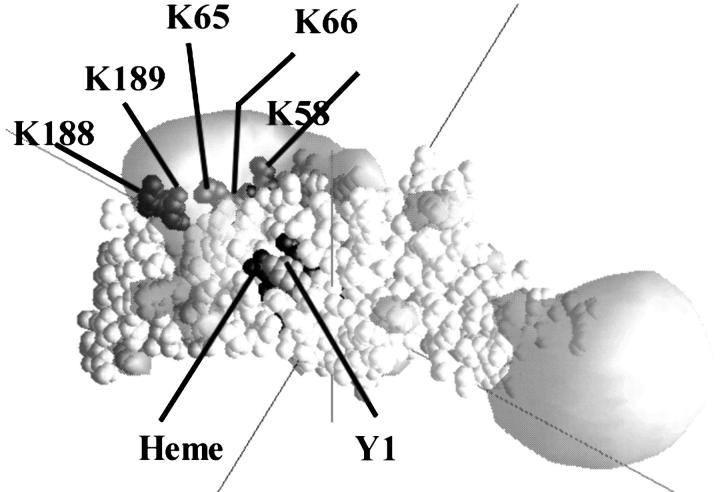
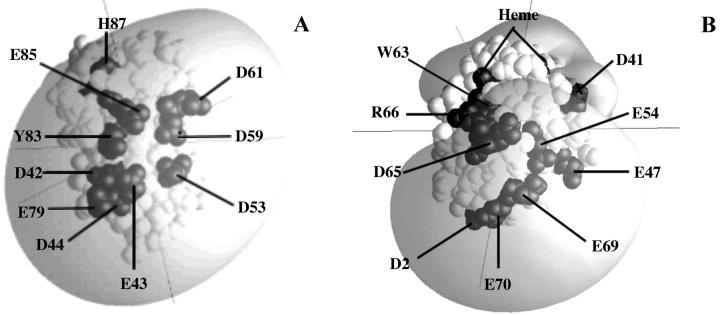
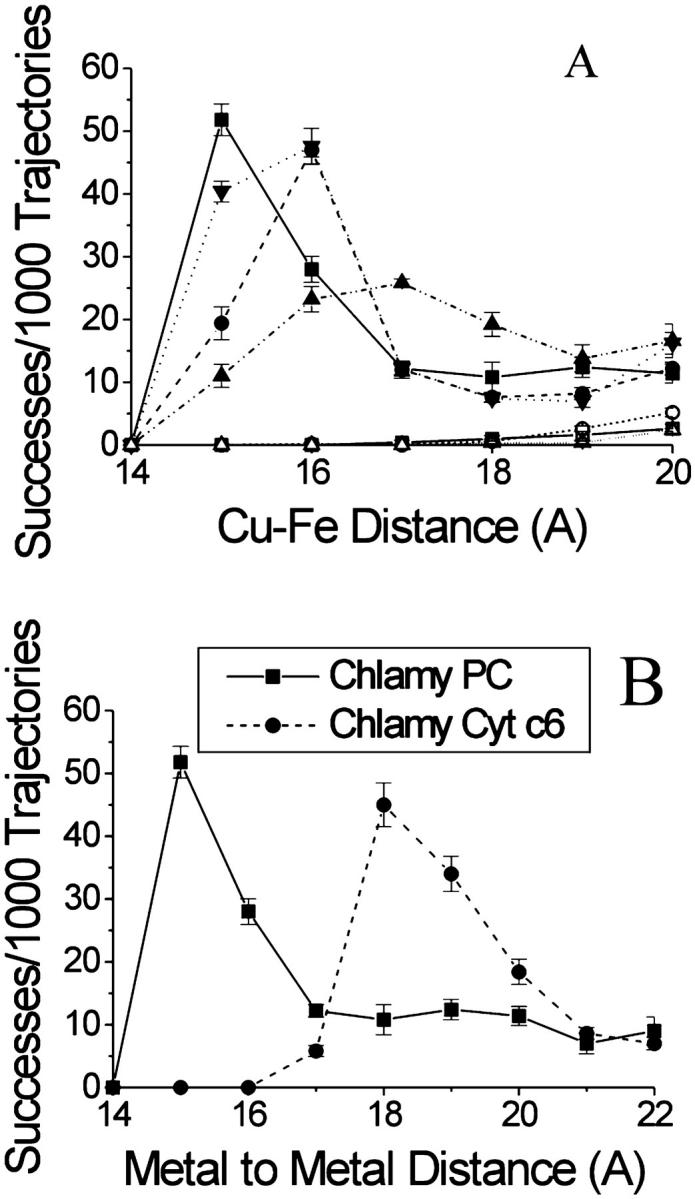
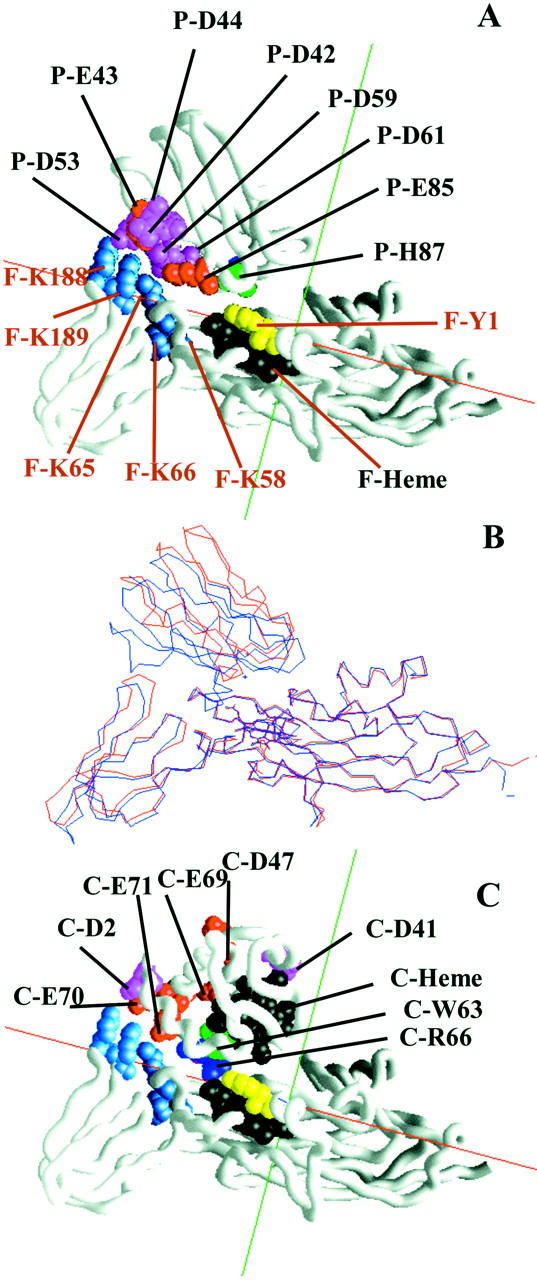
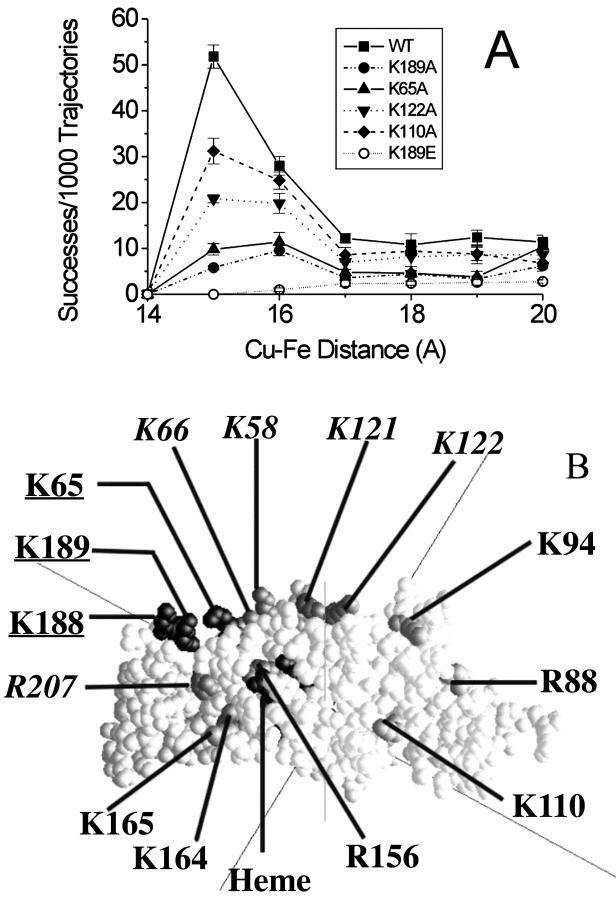
The interaction of Chlamydomonas cytochrome f (cyt f) with either Chlamydomonas plastocyanin (PC) or Chlamydomonas cytochrome c(6) (cyt c(6)) was studied using Brownian dynamics simulations. The two electron acceptors (PC and cyt c(6)) were found to be essentially interchangeable despite a lack of sequence homology and different secondary structures (beta-sheet for PC and alpha-helix for cyt c(6)). Simulations using PC and cyt c(6) interacting with cyt f showed approximately equal numbers of successful complexes and calculated rates of electron transfer. Cyt f-PC and cyt f-cyt c(6) showed the same types of interactions. Hydrophobic residues surrounding the Y1 ligand to the heme on cyt f interacted with hydrophobic residues on PC (surrounding the H87 ligand to the Cu) or cyt c(6) (surrounding the heme). Both types of complexes were stabilized by electrostatic interactions between K65, K188, and K189 on cyt f and conserved anionic residues on PC (E43, D44, D53, and E85) or cyt c(6) (E2, E70, and E71). Mutations on cyt f had identical effects on its interaction with either PC or cyt c(6). K65A, K188A, and K189A showed the largest effects whereas residues such as K217A, R88A, and K110A, which are located far from the positive patch on cyt f, showed very little inhibition. The effect of mutations observed in Brownian dynamics simulations paralleled those observed in experiments.
Figures

Similar articles
-
Brownian dynamics study of cytochrome f interactions with cytochrome c6 and plastocyanin in Chlamydomonas reinhardtii plastocyanin, and cytochrome c6 mutants.Biophys J. 2005 Mar;88(3):2323-39. doi: 10.1529/biophysj.104.053561. Epub 2004 Dec 30. Biophys J. 2005. PMID: 15626695 Free PMC article.
-
A Brownian dynamics study of the interaction of Phormidium laminosum plastocyanin with Phormidium laminosum cytochrome f.Biophys J. 2004 Sep;87(3):2043-59. doi: 10.1529/biophysj.103.038497. Biophys J. 2004. PMID: 15345580 Free PMC article.
-
A Brownian dynamics study of the effects of cytochrome f structure and deletion of its small domain in interactions with cytochrome c6 and plastocyanin in Chlamydomonas reinhardtii.Biophys J. 2006 Jan 15;90(2):566-77. doi: 10.1529/biophysj.105.067058. Epub 2005 Oct 20. Biophys J. 2006. PMID: 16239335 Free PMC article.
-
Weak interactions and molecular recognition in systems involving electron transfer proteins.Chem Rec. 2001;1(4):290-9. doi: 10.1002/tcr.1014. Chem Rec. 2001. PMID: 11893069 Review.
-
Close encounters of the transient kind: protein interactions in the photosynthetic redox chain investigated by NMR spectroscopy.Acc Chem Res. 2003 Oct;36(10):723-30. doi: 10.1021/ar0200955. Acc Chem Res. 2003. PMID: 14567705 Review.
Cited by
-
Catalytic Reactions and Energy Conservation in the Cytochrome bc1 and b6f Complexes of Energy-Transducing Membranes.Chem Rev. 2021 Feb 24;121(4):2020-2108. doi: 10.1021/acs.chemrev.0c00712. Epub 2021 Jan 19. Chem Rev. 2021. PMID: 33464892 Free PMC article. Review.
-
A Brownian dynamics study of the interactions of the luminal domains of the cytochrome b6f complex with plastocyanin and cytochrome c6: the effects of the Rieske FeS protein on the interactions.Biophys J. 2006 Oct 1;91(7):2589-600. doi: 10.1529/biophysj.106.085936. Epub 2006 Jul 14. Biophys J. 2006. PMID: 16844750 Free PMC article.
-
New direct dynamic models of protein interactions coupled to photosynthetic electron transport reactions.Biophys Rev. 2010 Aug;2(3):101-110. doi: 10.1007/s12551-010-0033-4. Epub 2010 Jun 10. Biophys Rev. 2010. PMID: 28510068 Free PMC article. Review.
-
A novel approach to computer simulation of protein-protein complex formation.Dokl Biochem Biophys. 2009 Jul-Aug;427:215-7. doi: 10.1134/s1607672909040127. Dokl Biochem Biophys. 2009. PMID: 19817140 No abstract available.
-
Brownian dynamics study of cytochrome f interactions with cytochrome c6 and plastocyanin in Chlamydomonas reinhardtii plastocyanin, and cytochrome c6 mutants.Biophys J. 2005 Mar;88(3):2323-39. doi: 10.1529/biophysj.104.053561. Epub 2004 Dec 30. Biophys J. 2005. PMID: 15626695 Free PMC article.
References
-
- Anderson, G. P., D. G. Sanderson, C. H. Lee, S. Durell, L. B. Anderson, and E. L. Gross. 1987. The effect of ethylene diamine chemical modification of plastocyanin on the rate of cytochrome f oxidation and P-700+ reduction. Biochim. Biophys. Acta. 894:386–398. - PubMed
-
- Badsberg, U., A. M. Jorgensen, H. Gesmar, J. J. Led, J. M. Hammerstad, L. L. Jespersen, and J. Ulstrop. 1996. Solution structure of reduced plastocyanin from the blue-green alga Anabaena variabilis. Biochemistry. 35:7021–7031. - PubMed
-
- Baker, E. N. 1988. Structure of azurin from Alcaligenes denitrificans: refinement at 1.8 Å resolution and comparison of the two crystallographically independent molecules. J. Mol. Biol. 203:1071–1095. - PubMed
-
- Bendall, D. S. 1996. Interprotein electron transfer. In Protein Electron Transfer, D. S. Bendall, editor. Bios. Scientific Publisher, Oxford, UK. 43–68.
MeSH terms
Substances
LinkOut - more resources
Full Text Sources
Research Materials
