. 2003 Sep;23(18):6363-72.
doi: 10.1128/MCB.23.18.6363-6372.2003.

Rad52-independent accumulation of joint circular minichromosomes during S phase in Saccharomyces cerevisiae

Affiliations

Rad52-independent accumulation of joint circular minichromosomes during S phase in Saccharomyces cerevisiae

Ralf Erik Wellinger et al. Mol Cell Biol. 2003 Sep.

Abstract

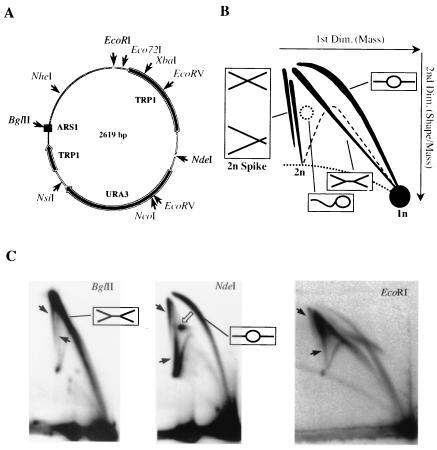
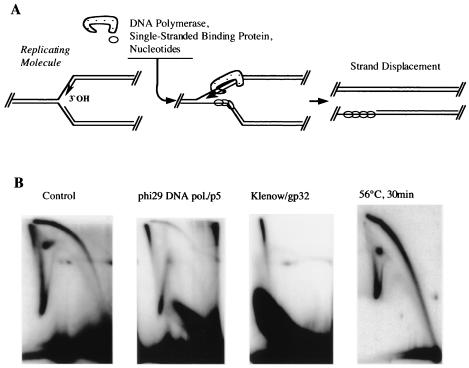
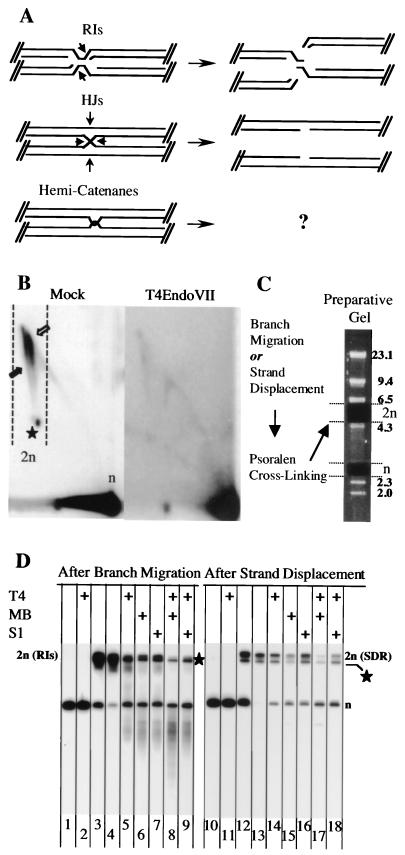
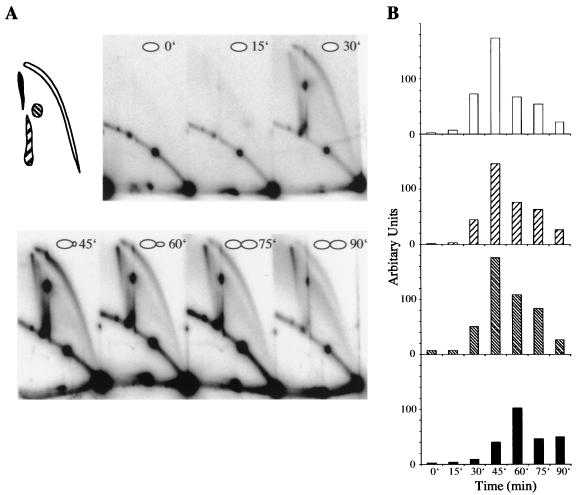
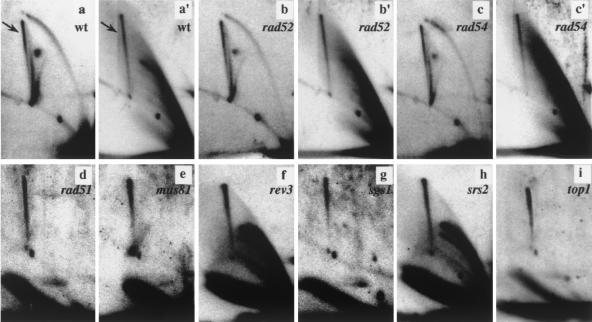
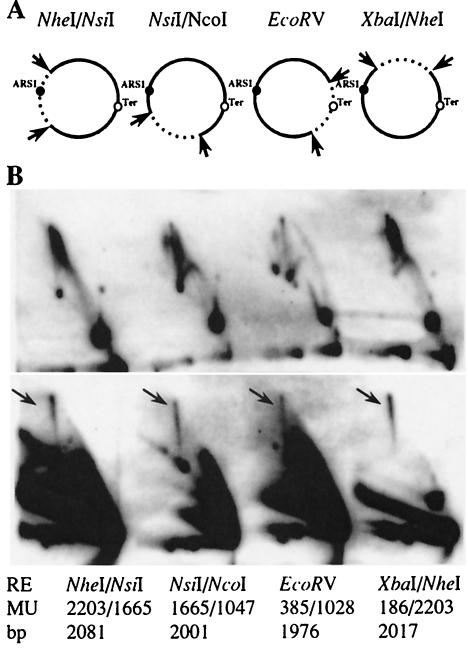
We investigated the formation of X-shaped molecules consisting of joint circular minichromosomes (joint molecules) in Saccharomyces cerevisiae by two-dimensional neutral/neutral gel electrophoresis of psoralen-cross-linked DNA. The appearance of joint molecules was found to be replication dependent. The joint molecules had physical properties reminiscent of Holliday junctions or hemicatenanes, as monitored by strand displacement, branch migration, and nuclease digestion. Physical linkage of the joint molecules was detected along the entire length of the minichromosome and most likely involved newly replicated sister chromatids. Surprisingly, the formation of joint molecules was found to be independent of Rad52p as well as of other factors associated with a function in homologous recombination or in the resolution of stalled replication intermediates. These findings thus imply the existence of a nonrecombinational pathway(s) for the formation of joint molecules during the process of DNA replication or minichromosome segregation.


Figures

FIG. 1.
FIG. 1.
Two-dimensional gel analysis of YRpTRURAP. (A) Schematic representation of YRpTRURAP. Shown are relevant restriction sites (thin arrows), the origin of replication (ARS1, black box), and the TRP1 and URA3 genes (thick arrows) (for details, see reference 54). (B) Diagram of the migration patterns of replication and recombination intermediates of singly-cut minichromosome after two-dimensional gel electrophoresis. The direction of first- and second-dimension electrophoresis (arrows), migration pattern bubble- and double-Y-shaped molecules (black lines; interpretation in boxes), as well as simple Y-shaped molecules (dashed lines) are indicated. The double spike represents the migration pattern of two populations of 2n-shaped molecules. See text for details. (C) Two-dimensional gel electrophoretic analysis of YRpTRURAP from an exponential-phase culture. Prior to analysis, Qiagen-purified DNA was linearized with the restriction enzyme indicated on top. Depicted are the resulting replicating molecules (interpretation in boxes), different populations of molecules in the 2n spike (black arrows), and δ-like structures (open arrow). To achieve sufficient resolution of the 2n spikes of the EcoRI-digested DNA, the second-dimension electrophoresis was prolonged (17 h).
FIG. 2.
FIG. 2.
2n spike contains strand displacement-resistant but branch migration-sensitive population of molecules. (A) Scheme depicting the effect of DNA polymerase and single-stranded-DNA binding protein on replicating molecules. Initiation of strand displacement at the leading strand (arrow, 3′OH) is indicated. (B) Two-dimensional gel electrophoretic analysis of YRpTRURAP replicating and recombining intermediates linearized with NdeI (see Fig. 1A) following the treatment indicated above the autoradiograms. Note that different gel running conditions (1.5% agarose in the second dimension) were used in the three first panels and that the DNA was purified on Qiagen columns.
FIG. 3.
FIG. 3.
Enzymatic characterization of 2n molecules. (A) Putative shapes of 2n molecules. Indicated are the nuclease cleavage sites necessary for structure resolution (arrows). RIs, replicative intermediates; HJs, Holliday junctions. (B) Two-dimensional gel analysis of mock-treated (left) and T4 endonuclease VII-treated (right) minichromosomes. CTAB-purified DNA from cells 90 min after release from α-factor was linearized with Eco72I (see Fig. 1). The locations of the n- and 2n-sized molecules (arrows and star, respectively, within the dashed lines) are indicated. Note that the experimental conditions led to clear detection of both 2n spikes. In contrast, two-dimensional gel analysis of Eco72I-digested DNA isolated from synchronized cells 45 min after α-factor release (data not shown) gave a result similar to that obtained with EcoRI-digested DNA (see Fig. 1C). (C) Schematic illustration for the isolation of n- and 2n-sized molecules from a preparative gel. After branch migration or strand displacement, molecules were further stabilized by psoralen-DNA cross-linking. With this treat-ment, structural changes are prevented during the high-temperature DNA extraction procedure from low-melting-point agarose. To remove the correct agarose gel plugs, TRURAP DNA was mixed with HindIII-digested lambda marker DNA (fragment sizes are indicated in kilobases to the right). (D) Southern blot analysis of 2n molecules after branch migration (lanes 1 to 9) or strand displacement followed by psoralen-DNA cross-linking (lanes 10 to18). The n-sized molecules (lanes 1, 2, 10, and 11) and 2n-sized molecules were isolated once (lanes 3 and 12) or twice (lanes 4 to 9 and 13 to 18) from preparative gels. The DNA was either mock treated (lanes 1, 3, 4, 10, 12, and 13) or treated with T4 endonuclease VII (T4), mung bean nuclease (MB), or S1 nuclease (S1), as indicated on top. The migration of the n-sized molecules is indicated to the right. The star indicates putatively linear molecules of size 2n (see text for details). The smear-like signal between the n and 2n molecules (lanes 5 to 7) most likely resulted from partially cleaved replication intermediates. Note that whereas T4 endonuclease VII specifically cleaves the leading arm of the replication forks (17), the mung bean and S1 nucleases can also cut the lagging arm of the replication forks.
FIG. 4.
FIG. 4.
Two-dimensional gel electrophoretic analysis of YRpTRURAP from a synchronized culture. (A) Yeast cells were synchronized by α-factor arrest. After release from arrest, samples were withdrawn from the culture, and CTAB-purified DNA was digested with NdeI (see Fig. 1A). The time points taken are indicated on the autoradiogram. The regions used for quantification are indicated in the left diagram. (B) The quantitative data from A were plotted as a function of time. Replicating molecules include the bubble arc (white bars), lasso-type molecules (right dashed bars), and 2n-sized replicative intermediates (left hatched bars). While replicating molecules were most abundant after 45 min, the majority of SDR molecules were apparent 60 min after α-factor release (black bars).
FIG. 5.
FIG. 5.
SDR molecule formation does not depend on proteins involved in recombination. Two-dimensional gel electrophoretic analysis of CTAB-purified and NdeI-digested minichromosomes before (panels a to c) and after (panels a′ to c′ and d to i) strand displacement. DNAs from the wild type (wt, panels a and a′) and the isogenic rad52 (panels b and b′), rad54 (panels c and c′), rad51 (panel d), mus81 (panel e), rev3 (panel f), sgs1 (panel g), srs2 (panel h), and top1 (panel i) strains are shown. The SDR molecules are indicated (arrows). We noticed a variation in the efficiency of the strand displacement reaction that was apparently related to the sample preparation. No apparent effects on replication intermediate distribution were detected on the mutant strains analyzed with respect to the wild type (compare panel a with panels b and c, and data not shown).
FIG. 6.
FIG. 6.
Frequency of SDR molecules in various regions of YRpTRURAP. (A) CTAB-purified plasmid DNA was digested with different restriction enzymes (arrow) to create two fragments of about 500 bp and 2 kb in length. The relative location of ARS1 (black dot) and the zone of replication termination (Ter, empty dot) are indicated. (B) Two-dimensional gel electrophoresis of the fragments before (top panel) and after (bottom panel) strand displacement. The SDR molecules are marked (black arrow). Cleavage sites of the restriction enzymes (RE) relative to EcoRI in map units (MU; EcoRI = map unit 0; see Fig. 1) and the expected size of the 2-kb fragment (in base pairs) are indicated at the bottom.

Similar articles

Cited by

References

    1. Allers, T., and M. Lichten. 2000. A method for preparing genomic DNA that restrains branch migration of Holliday junctions. Nucleic Acids Res. 28:e6. - PMC - PubMed
    1. Bai, Y., and L. S. Symington. 1996. A Rad52 homolog is required for RAD51-independent mitotic recombination in Saccharomyces cerevisiae. Genes Dev. 10:2025-2037. - PubMed
    1. Barre, F. X., B. Soballe, B. Michel, M. Aroyo, M. Robertson, and D. Sherratt. 2001. Circles: the replication-recombination-chromosome segregation connection. Proc. Natl. Acad. Sci. USA 98:8189-8195. - PMC - PubMed
    1. Bates, A. D., and A. Maxwell. 1993. DNA topology. Oxford University Press, Oxford, UK.
    1. Bell, L., and B. Byers. 1983. Separation of branched from linear DNA by two-dimensional gel electrophoresis. Anal. Biochem. 130:527-535. - PubMed

Publication types

MeSH terms

Substances