. 2003 Sep;23(18):6618-30.
doi: 10.1128/MCB.23.18.6618-6630.2003.

PSF acts through the human immunodeficiency virus type 1 mRNA instability elements to regulate virus expression

Affiliations

PSF acts through the human immunodeficiency virus type 1 mRNA instability elements to regulate virus expression

Andrei S Zolotukhin et al. Mol Cell Biol. 2003 Sep.

Abstract

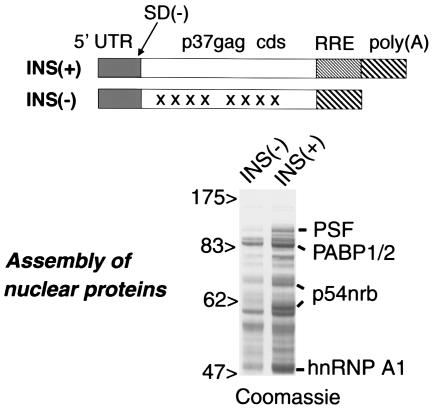
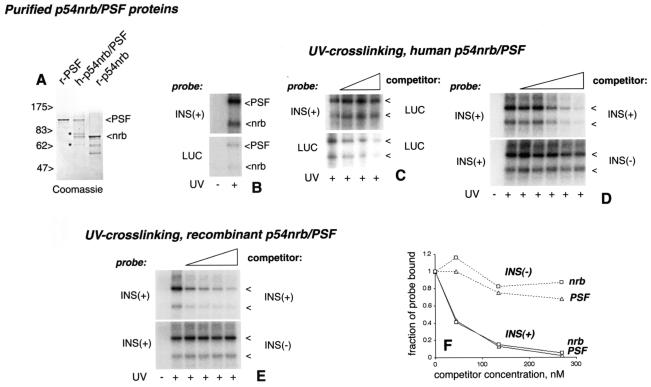
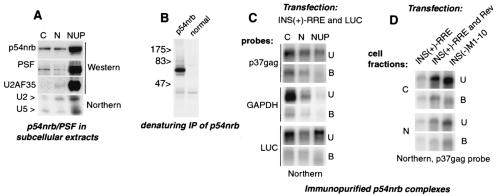
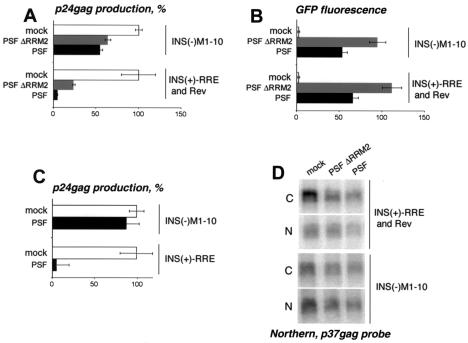
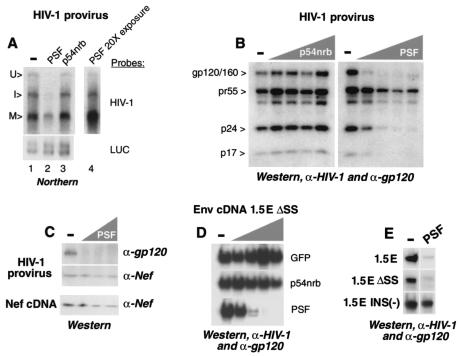
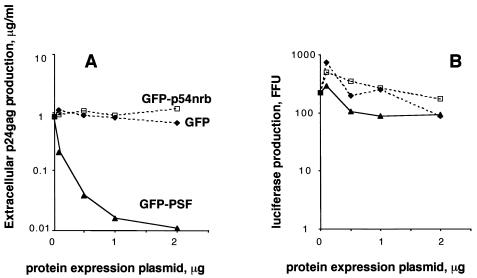
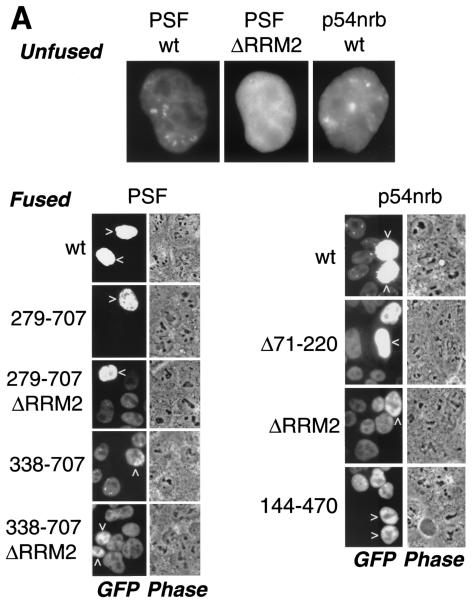
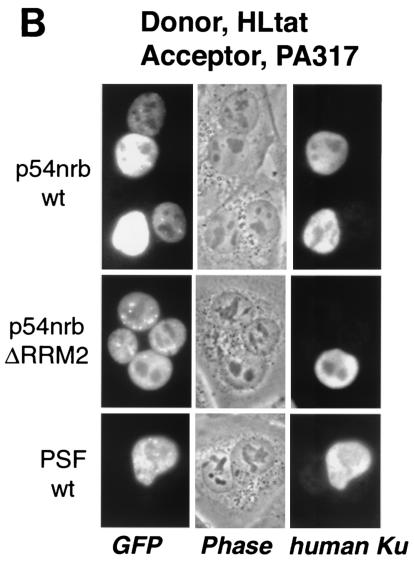
Human immunodeficiency virus type 1 (HIV) gag/pol and env mRNAs contain cis-acting regulatory elements (INS) that impair stability, nucleocytoplasmic transport, and translation by unknown mechanisms. This downregulation can be counteracted by the viral Rev protein, resulting in efficient export and expression of these mRNAs. Here, we show that the INS region in HIV-1 gag mRNA is a high-affinity ligand of p54nrb/PSF, a heterodimeric transcription/splicing factor. Both subunits bound INS RNA in vitro with similar affinity and specificity. Using an INS-containing subgenomic gag mRNA, we show that it specifically associated with p54nrb in vivo and that PSF inhibited its expression, acting via INS. Studying the authentic HIV-1 mRNAs produced from an infectious molecular clone, we found that PSF affected specifically the INS-containing, Rev-dependent transcripts encoding Gag-Pol and Env. Both subunits contained nuclear export and nuclear retention signals, whereas p54nrb was continuously exported from the nucleus and associated with INS-containing mRNA in the cytoplasm, suggesting its additional role at late steps of mRNA metabolism. Thus, p54nrb and PSF have properties of key factors mediating INS function and likely define a novel mRNA regulatory pathway that is hijacked by HIV-1.


Figures

FIG. 1.
FIG. 1.
Assembly of nuclear proteins onto INS-RNA. The in vitro-transcribed INS(+) and INS(−) RNAs are shown schematically, indicating the 5′ untranslated region (UTR), p37gag cds, RRE, and poly(A) site and the deletion destroying the major HIV-1 5′ splice site [SD(−)]. In INS(−) RNA, the regions containing inactivating mutations (50) are shown by X. The INS(+) and INS(−) RNAs were immobilized on streptavidin beads and incubated with HeLa nuclear extracts. The assembled proteins were separated by SDS-PAGE and stained with Coomassie, and the major bands in the INS(+)-bound fraction were identified by microsequencing, as shown to the right. The sizes of marker proteins are shown (in kilodaltons).
FIG. 2.
FIG. 2.
p54nrb and PSF bind specifically to INS-RNA in vitro. (A) SDS-PAGE analysis of purified p54nrb/PSF proteins. r-PSF, recombinant His-tagged PSF; h-p54nrb/PSF, purified human p54nrb/PSF dimer; r-p54nrb, recombinant p54nrb. The sizes of marker proteins are shown (in kilodaltons). The positions of p54nrb and PSF are indicated to the right. Asterisks indicate the bands of contaminating proteins in the h-p54nrb/PSF fraction. (B to E) RNA binding/UV cross-linking with purified human (B, C, and D) and recombinant (E) p54nrb/PSF dimer. The radioactive RNA probes (indicated on the left) and the competitor RNAs (indicated on the right) are indicated. The competitors were present at final concentrations of 15, 45, and 135 nM (C); 5, 15, 45, 135, and 270 nM (panel D); and 77, 156, 311, and 622 nM (E), as indicated by triangles. As a control, some reactions were not UV-irradiated, as indicated at the bottom. The cross-linked p54nrb and PSF proteins (indicated by arrowheads) were separated by SDS-PAGE and detected by autoradiography. In panel C, a stronger exposure was used to visualize the luc probe cross-links. (F) Quantification of the cross-links from panel D. The radioactivity values were determined with a phosphorimager, normalized to those obtained without competition (fraction of probe bound, y axis), and were plotted against the competitor concentrations (x axis).
FIG. 3.
FIG. 3.
p54nrb associates with INS(+) mRNA in vivo. (A) 293 cells were fractionated into cytoplasmic (C), soluble nuclear (N,) and insoluble nuclear (NUP) extracts. Top panels: Western blot analysis with monoclonal antibodies to p54nrb (Transduction Labs) and PSF (Sigma) and with rabbit anti-U2AF35 serum (66), as indicated to the left. Bottom panel: total RNA was extracted from the same fractions, separated on a 15% Tris-borate-EDTA-urea gel, and analyzed on Northern blots for U2 and U5 snRNPs (64). (B) 293 cells were labeled with [35S]methionine and extracted with 0.5× radioimmunoprecipitation assay buffer, and proteins were immunoprecipitated under denaturing conditions with normal or anti-p54nrb rabbit serum (60) as indicated. The sizes of marker proteins are shown (in kilodaltons). (C) 293 cells were cotransfected with 1 μg of INS(+)-RRE and 0.1 μg of luciferase (luc) expression plasmid. At day 2, cell extracts (shown on top) were immunoprecipitated with p54nrb antibodies. The polyadenylated RNA was extracted from immunoprecipitates (bound, B) and from 1:10 aliquots of the supernatants (unbound, U) and analyzed on Northern blots with p37gag, luc, and GAPDH probes, as shown to the right. (D) 293 cells were transfected with 1 μg of INS(+)-RRE in the presence or in the absence of 0.05 μg of Rev expression plasmid and with INS(−)M1-10 expression plasmids, as indicated. Cell extraction, immunoprecipitation with p54nrb antibodies, and Northern analysis with p37gag probe were performed as in panel A.
FIG. 4.
FIG. 4.
Exogenous PSF acts via INS to inhibit INS-mRNA expression. 293 cells were transfected with 1 μg of INS(+)-RRE in the presence or in the absence of 0.05 μg of Rev expression plasmid or with 1 μg of INS(−)M1-10 expression plasmid. (A to C) Transfections were performed in the absence (mock) or in the presence of 1.5 μg of GFP-PSF plasmids. At day 2 posttransfection, p24gag production was measured, and the average values from triplicate plates were normalized to those obtained in the absence of PSF plasmids (100%) and plotted on the x axis (A and C). Panel B shows the normalized fluorescence levels of coexpressed GFP-PSF proteins for the experiment shown in panel A. The average values from triplicate plates are plotted on the x axis as arbitrary units. Bars, standard deviations. Similar data were obtained in several independent transfection experiments. Two representative, independent experiments are shown in panels A and C. (D) Transfections were performed as in panels A and B. At day 2, poly(A)-containing RNA was extracted from the nuclear and the cytoplasmic fractions and analyzed on Northern blots with a p37gag probe.
FIG. 5.
FIG. 5.
PSF affects Rev-dependent but not Rev-independent HIV-1 expression. (A) 293 cells were cotransfected with 3 μg of pNL4-3 HIV-1 proviral clone and 0.1 μg of L3LUC luciferase expression plasmid in the presence or in the absence (−) of 2 μg of GFP-p54nrb or GFP-PSF expression plasmid, as shown on top. At day 3 posttransfection, the cells were extracted with RNazol, and the poly(A)-containing RNA was isolated with oligo(dT) Dynabeads and analyzed on Northern blots, hybridized with HIV-1 and luc-specific radioactive probes, as shown to the right. The mRNAs were visualized by autoradiography. Lanes 1 to 3 represent the same exposure, and lane 4 shows a 20-fold overexposure of lane 2. The bands were quantified with a phosphorimager. U, unspliced; I, intermediate spliced; M, multiply spliced. (B) 293 cells were transfected in parallel to these shown in panel A, with 3 μg of pNL4-3 HIV-1 proviral plasmid in the presence or in the absence (−) of various amounts (0.1, 0.5, 1, and 2 μg) of GFP-p54nrb or GFP-PSF expression plasmid, as shown schematically on top. At day 3 posttransfection, the HIV-1 proteins (shown to the left) were analyzed on Western blots with a mix of patient HIV-1 serum and gp120 antibodies. Similar results were obtained in three independent transfection experiments. (C) Western blot analysis of Env and Nef proteins, as indicated to the right. Top (HIV-1 provirus): same extracts as in panel B. Bottom (nef cDNA): 293 cells were cotransfected with 1 μg of Nef expression plasmid pNL1.5.7 in the absence (−) or in the presence of GFP-PSF plasmid. The amounts of cotransfected PSF plasmid (0.1, 0.5, and 1 μg) are shown schematically. The protein bands were quantified with a Phosphorimager. Similar results were obtained in three independent transfection experiments. (D) 293 cells were cotransfected with 1 μg of p1.5EΔSS and 0.1 μg of BsRev expression plasmids in the absence (−) or in the presence of various amounts (0.1, 0.5, 1, and 2 μg; shown schematically on top) of GFP-p54nrb, GFP-PSF, or empty GFP expression plasmids, as shown to the right. At day 3 posttransfection, the Env proteins were detected on Western blots with a mix of HIV-1 patient serum (Scripps) and gp120 antibodies. Similar data were obtained in several independent experiments. (E) 293 cells were transfected with 1 μg of p1.5E, p1.5EΔSS, or p1.5E INS(−) plasmid, as shown to the left, in the absence (−) or in the presence of 1 μg of GFP-PSF plasmid, as shown on top. The p1.5E and p1.5EΔSS transfections also contained 0.1 μg of BsRev expression plasmid. The Env protein (gp120/160) was detected on Western blots, as described above.
FIG. 6.
FIG. 6.
Exogenous PSF inhibits HIV-1 virus production. Transfections of 293 cells were performed as in Fig. 5A, with a fixed amount of NL4-3 plasmid, in the absence or in the presence of various amounts (plotted on the x axis) of GFP-PSF (triangles), GFP-p54nrb (rectangles), and the GFP moiety alone (diamonds). All transfections included 0.1 μg of L3LUC luciferase expression plasmid. (A) p24gag antigen was measured in the cell culture medium, and the values are plotted on the y axis. (B) In the same transfections, luciferase activity was measured in cell extracts, and the values are plotted on the y axis (firefly units, FFU). Similar data were obtained in three independent experiments.
FIG. 7.
FIG. 7.
p54nrb and PSF contain nuclear export determinants. (A) HLtat cells were transfected with 1 μg of GFP-tagged PSF and p54nrb expression plasmids and mixed with an excess of untransfected HLtat cells. The next day, cells were fused with polyethylene glycol and fixed with 3.7% formaldehyde 2 h postfusion, and the GFP fluorescence was detected by fluorescent microscopy and a charge-coupled device camera. The top panel shows GFP fluorescence images of cells before fusion. The bottom panels show GFP fluorescence and phase contrast images of the same fields after fusion. Arrowheads indicate donor nuclei. Representative fields are shown, and similar results were obtained in several independent experiments. (B) HLtat cells were transfected, fused, and processed as in panel A but with PA317 cells as the acceptor. The human Ku autoantigen was detected by indirect immunofluorescence with Ku(p80)(Ab-1) monoclonal antibody (Oncogene Research Products) and Alexa 594-conjugated goat anti-mouse immunoglobulin antibody (Molecular Probes). The GFP fluorescence, phase contrast, and indirect immunofluorescence images were captured from the same fields. (C) Summary of GFP-PSF and GFP-p54nrb mutants. In the wild-type proteins, the known domains are indicated (18, 45). P/Q, region rich in proline and glutamine. RRM1 and -2, RNA recognition motifs. NLS, nuclear localization signals. The amino acid residues included in each fusion are shown to the left, with the black bars indicating the corresponding regions of the full-length protein. Dashed lines indicate internal deletions. To the right is a column summarizing the shuttling of fusion proteins: −, undetectable; +, strong; ++, very strong.
FIG. 7.
FIG. 7.
p54nrb and PSF contain nuclear export determinants. (A) HLtat cells were transfected with 1 μg of GFP-tagged PSF and p54nrb expression plasmids and mixed with an excess of untransfected HLtat cells. The next day, cells were fused with polyethylene glycol and fixed with 3.7% formaldehyde 2 h postfusion, and the GFP fluorescence was detected by fluorescent microscopy and a charge-coupled device camera. The top panel shows GFP fluorescence images of cells before fusion. The bottom panels show GFP fluorescence and phase contrast images of the same fields after fusion. Arrowheads indicate donor nuclei. Representative fields are shown, and similar results were obtained in several independent experiments. (B) HLtat cells were transfected, fused, and processed as in panel A but with PA317 cells as the acceptor. The human Ku autoantigen was detected by indirect immunofluorescence with Ku(p80)(Ab-1) monoclonal antibody (Oncogene Research Products) and Alexa 594-conjugated goat anti-mouse immunoglobulin antibody (Molecular Probes). The GFP fluorescence, phase contrast, and indirect immunofluorescence images were captured from the same fields. (C) Summary of GFP-PSF and GFP-p54nrb mutants. In the wild-type proteins, the known domains are indicated (18, 45). P/Q, region rich in proline and glutamine. RRM1 and -2, RNA recognition motifs. NLS, nuclear localization signals. The amino acid residues included in each fusion are shown to the left, with the black bars indicating the corresponding regions of the full-length protein. Dashed lines indicate internal deletions. To the right is a column summarizing the shuttling of fusion proteins: −, undetectable; +, strong; ++, very strong.

Similar articles

Cited by

References

    1. Adachi, A., H. E. Gendelman, S. Koenig, T. Folks, R. Willey, A. Rabson, and M. A. Martin. 1986. Production of acquired immunodeficiency syndrome-associated retrovirus in human and nonhuman cells transfected with an infectious molecular clone. J. Virol. 59:284-291. - PMC - PubMed
    1. Afonina, E., M. Neumann, and G. N. Pavlakis. 1997. Preferential binding of poly(A)-binding protein 1 to an inhibitory RNA element in the human immunodeficiency virus type 1 gag mRNA. J. Biol. Chem. 272:2307-2311. - PubMed
    1. Afonina, E., R. Stauber, and G. N. Pavlakis. 1998. The human poly(A)-binding protein 1 shuttles between the nucleus and the cytoplasm. J. Biol. Chem. 273:13015-13021. - PubMed
    1. Andersen, J. S., C. E. Lyon, A. H. Fox, A. K. Leung, Y. W. Lam, H. Steen, M. Mann, and A. I. Lamond. 2002. Directed proteomic analysis of the human nucleolus. Curr. Biol. 12:1-11. - PubMed
    1. Arrigo, S. J., and I. S. Y. Chen. 1991. Rev is necessary for translation but not cytoplasmic accumulation of HIV-1 vif, vpr, and env/vpu 2 RNAs. Genes Dev. 5:808-819. - PubMed

Publication types

MeSH terms

LinkOut - more resources