Comparative Study
. 2003 Sep;185(18):5442-51.
doi: 10.1128/JB.185.18.5442-5451.2003.

Global analyses of transcriptomes and proteomes of a parent strain and an L-threonine-overproducing mutant strain

Affiliations
Comparative Study

Global analyses of transcriptomes and proteomes of a parent strain and an L-threonine-overproducing mutant strain

Jin-Ho Lee et al. J Bacteriol. 2003 Sep.

Abstract

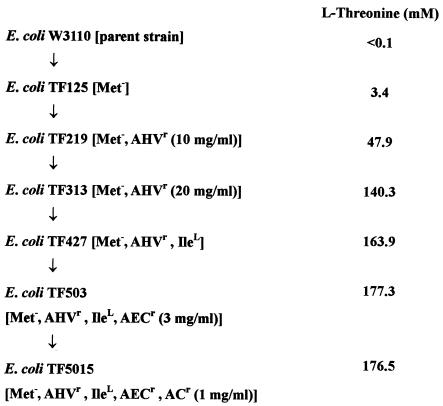
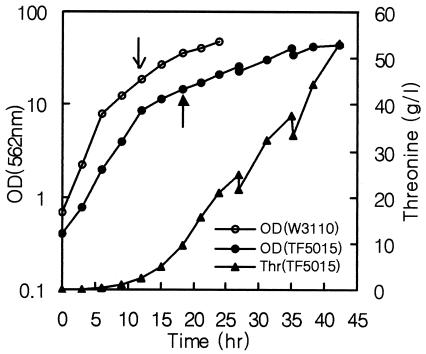
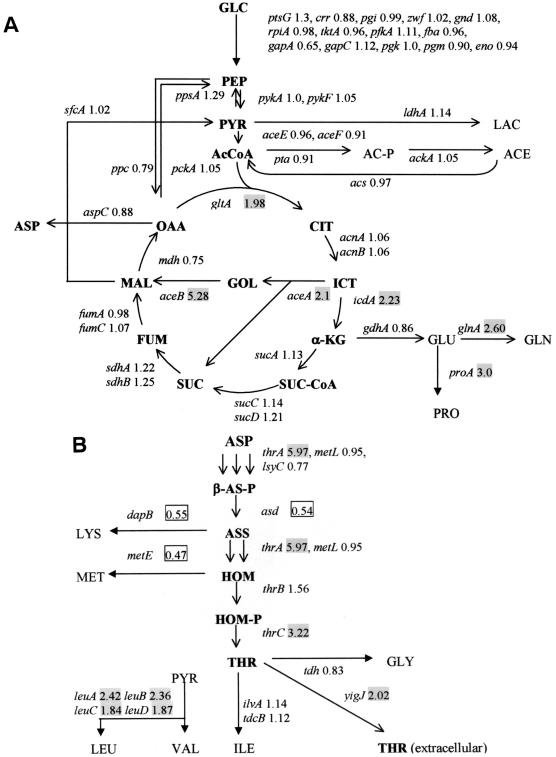
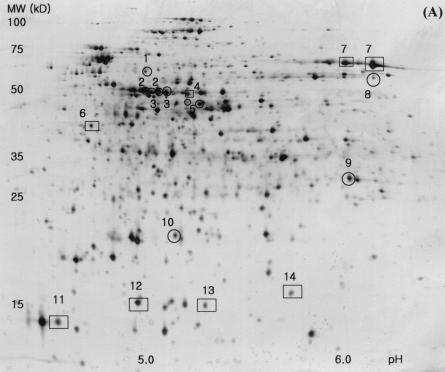
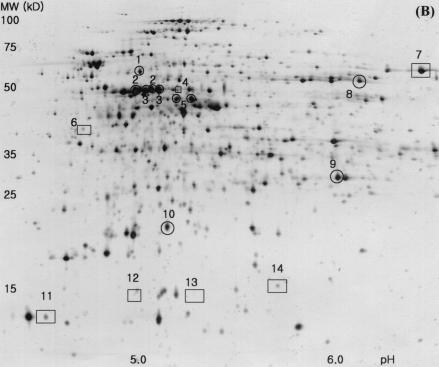
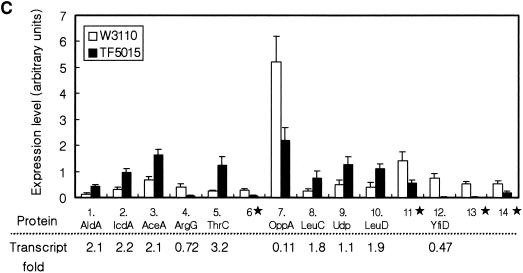
We compared the transcriptome, proteome, and nucleotide sequences between the parent strain Escherichia coli W3110 and the L-threonine-overproducing mutant E. coli TF5015. DNA macroarrays were used to measure mRNA levels for all of the genes of E. coli, and two-dimensional gel electrophoresis was used to compare protein levels. It was observed that only 54 of 4,290 genes (1.3%) exhibited differential expression profiles. Typically, genes such as aceA, aceB, icdA, gltA, glnA, leu operon, proA, thrA, thrC, and yigJ, which are involved in the glyoxylate shunt, the tricarboxylic acid cycle, and amino acid biosynthesis (L-glutamine, L-leucine, proline, and L-threonine), were significantly upregulated, whereas the genes dadAX, hdeA, hdeB, ompF, oppA, oppB, oppF, yfiD, and many ribosomal protein genes were downregulated in TF5015 compared to W3110. The differential expression such as upregulation of thr operon and expression of yigJ would result in an accumulation of L-threonine in TF5015. Furthermore, two significant mutations, thrA345 and ilvA97, which are essential for overproduction of L-threonine, were identified in TF5015 by the sequence analysis. In particular, expression of the mutated thrABC (pATF92) in W3110 resulted in a significant incremental effect on L-threonine production. Upregulation of aceBA and downregulation of b1795, hdeAB, oppA, and yfiD seem to be linked to a low accumulation of acetate in TF5015. Such comprehensive analyses provide information regarding the regulatory mechanism of L-threonine production and the physiological consequences in the mutant stain.


Figures

FIG. 1.
FIG. 1.
Genealogy of E. coli mutants producing l-threonine from E. coli W3110. Abbreviations: Met, l-methionine auxotroph; AHVr, resistant to α-amino-β-hydroxyvaleric acid; AECr, resistant to 2-aminoethyl-l-cysteine; IleL, l-isoleucine leaky character; ACr, resistant to l-azetidine-2-carboxylic acid. The production of l-threonine was conducted in a 250-ml flask (24).
FIG. 2.
FIG. 2.
Growth curve of E. coli W3110 and TF5015 in the fermentation medium. Cells were harvested at the time indicated in arrows.
FIG. 3.
FIG. 3.
Metabolic map showing relative expression ratios (intensity of TF5015 versus that of W3110) of transcript levels in the central metabolic pathway (A) and the threonine biosynthetic pathway (B). Abbreviations: GLC, glucose; PEP, phosphoenolpyruvate; PYR, pyruvate; LAC, lactate; Ac-CoA, acetyl-CoA; AC-P, acetyl-phosphate; ACE, acetate; CIT, citrate; ICT, isocitrate; α-KG, α-ketoglutarate; SUC-CoA, succinyl-CoA; FUM, fumarate; MAL, malate; OAA, oxaloacetate; GOL, glyoxylate; GLU, glutamate; GLN, glutamine; PRO, proline; ASP, aspartate; LYS, lysine; MET, methionine; β-AS-P, β-aspartyl phosphate; ASS, aspartate semialdehyde; HOM, homoserine; HOM-P, homoserine phosphate; THR, threonine; GLY, glycine; ILE, isoleucine; LEU, leucine; VAL, valine. The shaded and boxed numbers in the figure represent up- and downregulated genes, respectively, in TF5015.
FIG. 4.
FIG. 4.
Silver-stained two-dimensional gel patterns of E. coli W3110 (A) and E. coli TF5015 (B) at the same growth stage as DNA macroarray and quantification of protein spots showing differential expression patterns (C). In panels A and B, the horizontal axes represent pH, and the vertical axes represent molecular masses in kilodaltons. The transcript fold values (i.e., the relative intensity of transcript in TF5015 versus that of W3110) of corresponding genes are shown below the differently expressed proteins in panel C. 18 proteins (10 spots [○] of higher expression in TF5015 and 8 spots [□] of higher expression in W3110) showing differential expression patterns were selected, and 14 protein spots were identified by MALDI-TOF and shown in (C). Four proteins (IcdA, ThrC, AceA, and OppA) displayed double spots in the two-dimensional gels, respectively. The symbol (★) indicates unidentified protein spots. Spot intensities were measured and normalized as described in Materials and Methods. Error bars represent the standard deviation of the mean intensity. Continued.
FIG. 4.
FIG. 4.
Silver-stained two-dimensional gel patterns of E. coli W3110 (A) and E. coli TF5015 (B) at the same growth stage as DNA macroarray and quantification of protein spots showing differential expression patterns (C). In panels A and B, the horizontal axes represent pH, and the vertical axes represent molecular masses in kilodaltons. The transcript fold values (i.e., the relative intensity of transcript in TF5015 versus that of W3110) of corresponding genes are shown below the differently expressed proteins in panel C. 18 proteins (10 spots [○] of higher expression in TF5015 and 8 spots [□] of higher expression in W3110) showing differential expression patterns were selected, and 14 protein spots were identified by MALDI-TOF and shown in (C). Four proteins (IcdA, ThrC, AceA, and OppA) displayed double spots in the two-dimensional gels, respectively. The symbol (★) indicates unidentified protein spots. Spot intensities were measured and normalized as described in Materials and Methods. Error bars represent the standard deviation of the mean intensity. Continued.

References

    1. Arfin, S. M., A. D. Long, E. T. Ito, L. Tolleri, M. M. Riehle, E. S. Paegle, and G. W. Hatfield. 2000. Global gene expression profiling in Escherichia coli K-12. J. Biol. Chem. 275:29672-29684. - PubMed
    1. Arnold, C. N., J. Mcelhanon, A. Lee, R. Leonhart, and D. A. Siegele. 2001. Global analysis of Escherichia coli gene expression during the acetate-induced acid tolerance response. J. Bacteriol. 183:2178-2186. - PMC - PubMed
    1. Blankenhorn, D., J. Phillips, and J. L. Slonczewski. 1999. Acid- and base-induced proteins during aerobic and anaerobic gowth of Escherichia coli revealed by two-dimensional gel electrophoresis. J. Bacteriol. 181:2209-2216. - PMC - PubMed
    1. Calvo, J. M., and R. G. Mattews. 1994. The leucine-responsive regulatory protein, a global regulator of metabolism in Eshcerichia coli. Microbiol. Rev. 58:466-490. - PMC - PubMed
    1. Cronan, J. E., Jr., and D. LaPorte. 1996. Tricarboxylic acid cycle and glyoxylate bypass, p. 206-216. In F. C. Neidhardt, R. Curtiss III, J. L. Ingraham, E. C. C. Lin, K. B. Low, B. Magasanik, W. S. Reznikoff, M. Riley, M. Schaechter, and H. E. Umbarger (ed.), Escherichia coli and Salmonella typhimurium: cellular and molecular biology, 2nd ed. ASM Press, Washington, D.C.

Publication types

MeSH terms

LinkOut - more resources