

doi: 10.1128/JB.185.18.5632-5638.2003.
Periodicity of cell attachment patterns during Escherichia coli biofilm development
Affiliations
- PMID: 12949116
- PMCID: PMC193763
- DOI: 10.1128/JB.185.18.5632-5638.2003
Item in Clipboard
Periodicity of cell attachment patterns during Escherichia coli biofilm development
J Bacteriol.
2003 Sep.
Abstract
The complex architecture of bacterial biofilms inevitably raises the question of their design. Microstructure of developing Escherichia coli biofilms was analyzed under static and laminar flow conditions. Cell attachment during early biofilm formation exhibited periodic density patterns that persisted during development. Several models for the origination of biofilm microstructure are considered, including an activator-inhibitor or Turing model.
Figures
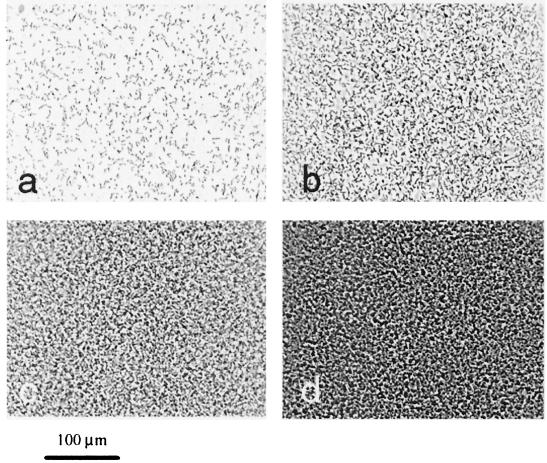
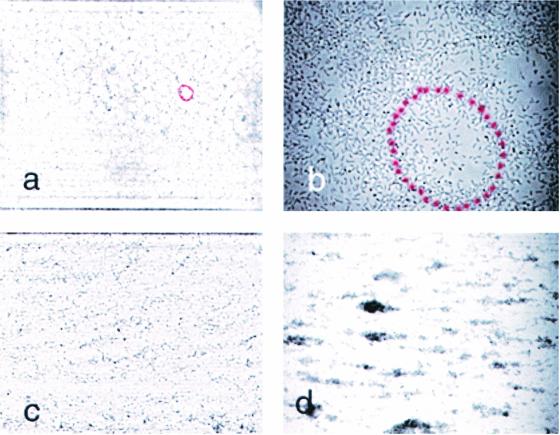
Biofilm development on poly-l -lysine-treated glass supports. A csrA::kanR mutant of MG1655 was grown at 26°C in a petri dish containing CFA medium and allowed to attach to coverslips. Micrographs (×40 objective) of attached cells in panels a to d were taken after 2, 4, 8, and 16 h of growth, respectively.
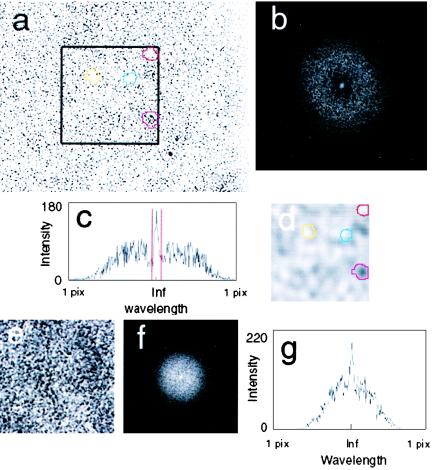
FFT analysis of cell distribution at the glass surface. (a) A digitized micrograph (×32 objective) of a biofilm at 4 h of growth. (b) Two-dimensional FFT spectrum of the data from panel a. (c) One-dimensional FFT spectrum, obtained from an intensity profile measured by a horizontal line that bisects the image of panel b. (d) The cell density pattern obtained by low-pass and reverse-transform operations. Note four distinct regions of cell density, highlighted in color, and the corresponding regions that are indicated in the micrograph of panel a. (e) An example of a quasi-random cell distribution: micrograph of the biofilm (×40 objective) obtained after 24 h of growth with obscured multiple layers of cells. (f) Two-dimensional FFT spectrum of data from panel e. (g) One-dimensional FFT spectrum obtained from an intensity profile of image of panel f, generated as in panel c.
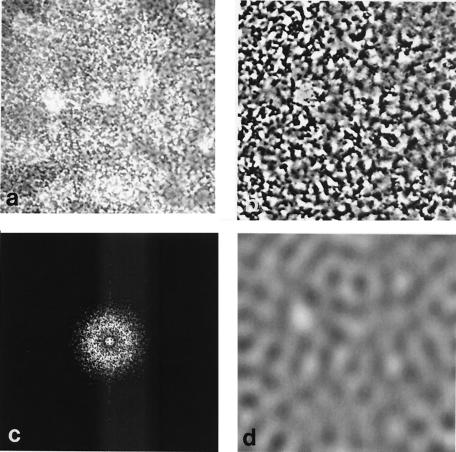
Periodic cell patterns from a multilayer biofilm. (a) Transmission light micrograph (×40 objective) of a 24-h biofilm, grown as in Fig. 1. (b) A contrast-enhanced portion of the image in panel a. (c) FFT spectrum of the image in panel b. (d) Cell density pattern after applying the low-pass and reverse-transform operations.
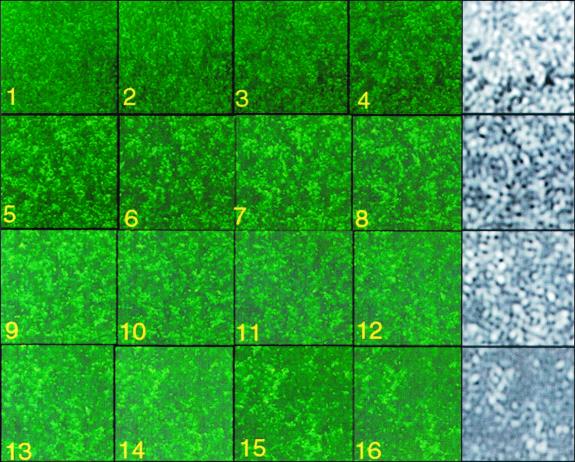
CLSM images of the cell distribution within a thick biofilm. Color panels (1 to 16) show optical sections parallel to the substrate starting at a distance of 2 μm and proceeding at 2-μm increments. Density distribution after FFT and low-pass operation for panels 4, 8, 12, and 16 are shown immediately to the right, in black and white.
Biofilm patterns in a flow cell. The csrA mutant of MG1655 was grown under laminar flow. The direction of the flow is from left to right in all panels. (a) Micrograph (×10 objective) at 96 h of growth at a flow rate of 15 ml/h of a culture that was inoculated under static conditions. The frame width of the image is 1,200 μm. (b) Same conditions (×100 objective) as in panel a, at a frame width of 120 μm. (c) Biofilm (×10 objective) after 50 h of cultivation at a flow rate of 15 ml/hour, with in-flow inoculation. The frame width of the image is 1,200 μm. (d) Biofilm (×10 objective) after 72 h of cultivation at a flow rate of 22 ml/h, with in-flow inoculation. The frame width of the image is 1,200 μm.
References
-
- Baker, C. S., I. Morozov, K. Suzuki, T. Romeo, and P. Babitzke. 2002. CsrA regulates glycogen biosynthesis by preventing translation of glgC in Escherichia coli. Mol. Microbiol. 44:1599-1610. - PubMed
-
- Bassler, B. L. 2002. Small talk: cell-to-cell communication in bacteria. Cell 109:421-424. - PubMed
-
- Bees, M. A., and N. A. Hill. 1997. Wavelengths of bioconvection patterns. J. Exp. Biol. 200:1515-1526. - PubMed
-
- Boissonade, J. 1994. Chemical patterns—long-range inhibition. Nature 369:188-189.
Publication types
MeSH terms
Substances
LinkOut - more resources
Full Text Sources
Other Literature Sources
