. 2003 Nov 15;553(Pt 1):243-65.
doi: 10.1113/jphysiol.2003.044222. Epub 2003 Aug 29.

Dynamic receptive fields of reconstructed pyramidal cells in layers 3 and 2 of rat somatosensory barrel cortex

Affiliations

Dynamic receptive fields of reconstructed pyramidal cells in layers 3 and 2 of rat somatosensory barrel cortex

Michael Brecht et al. J Physiol. .

Abstract

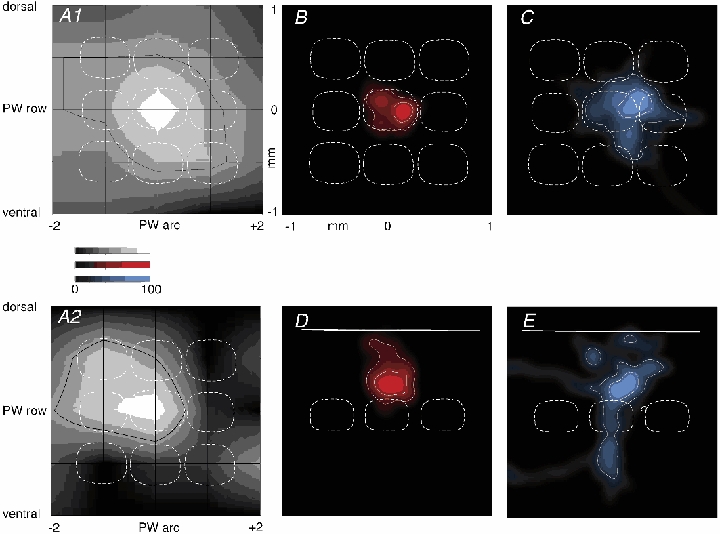
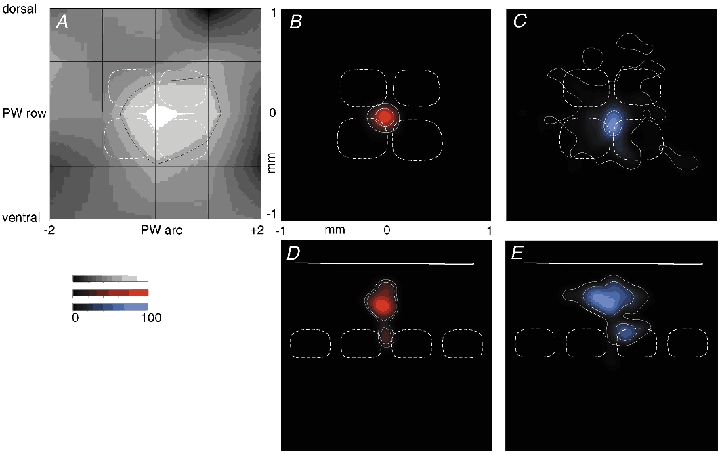
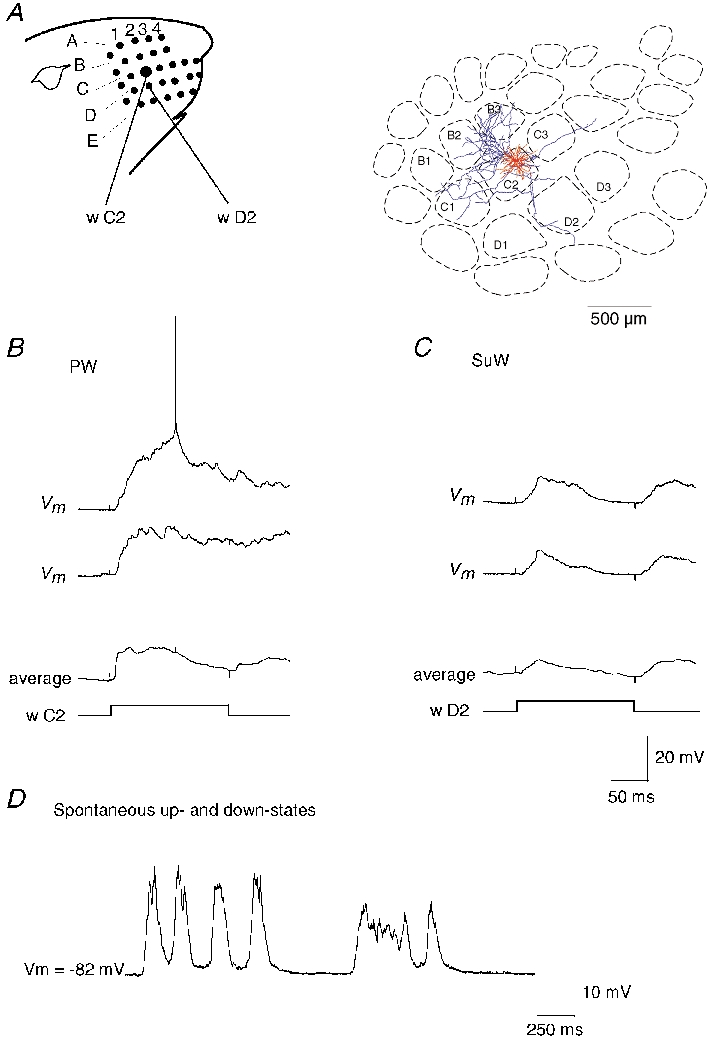
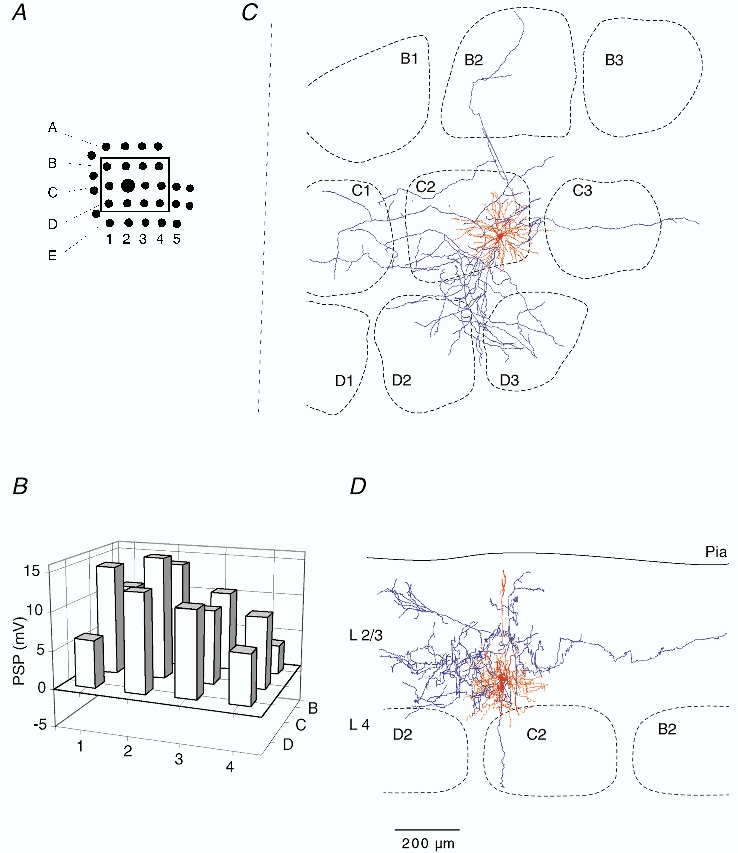
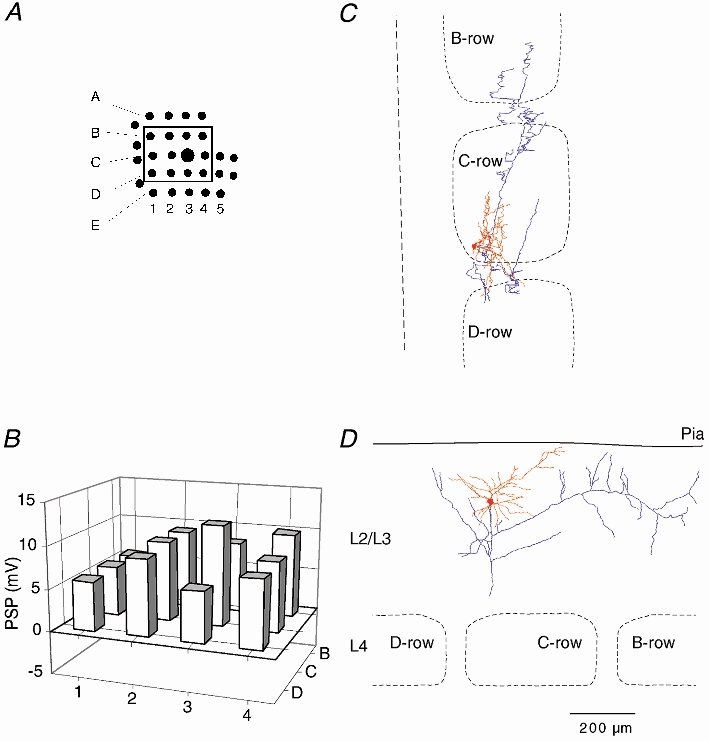
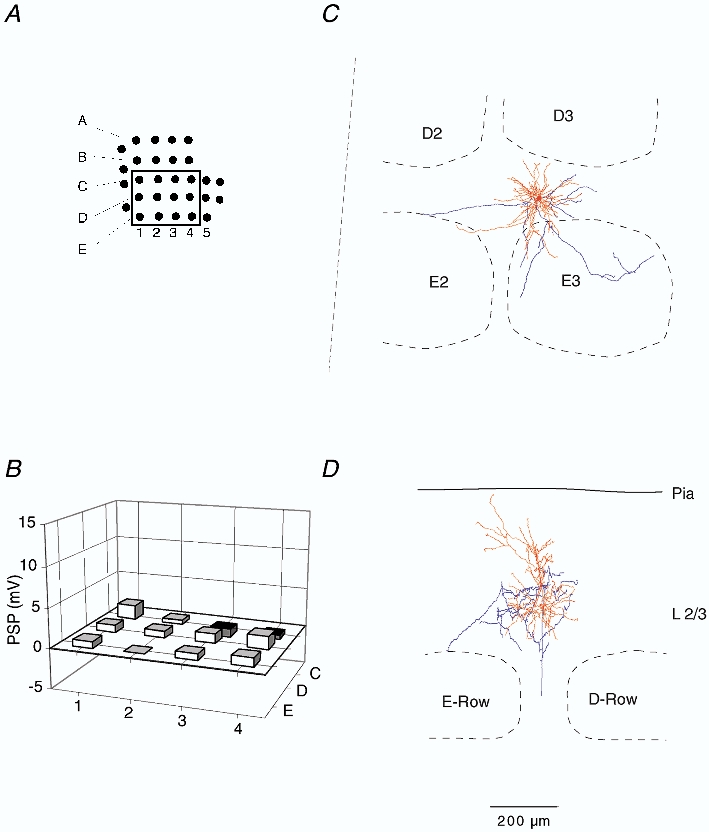
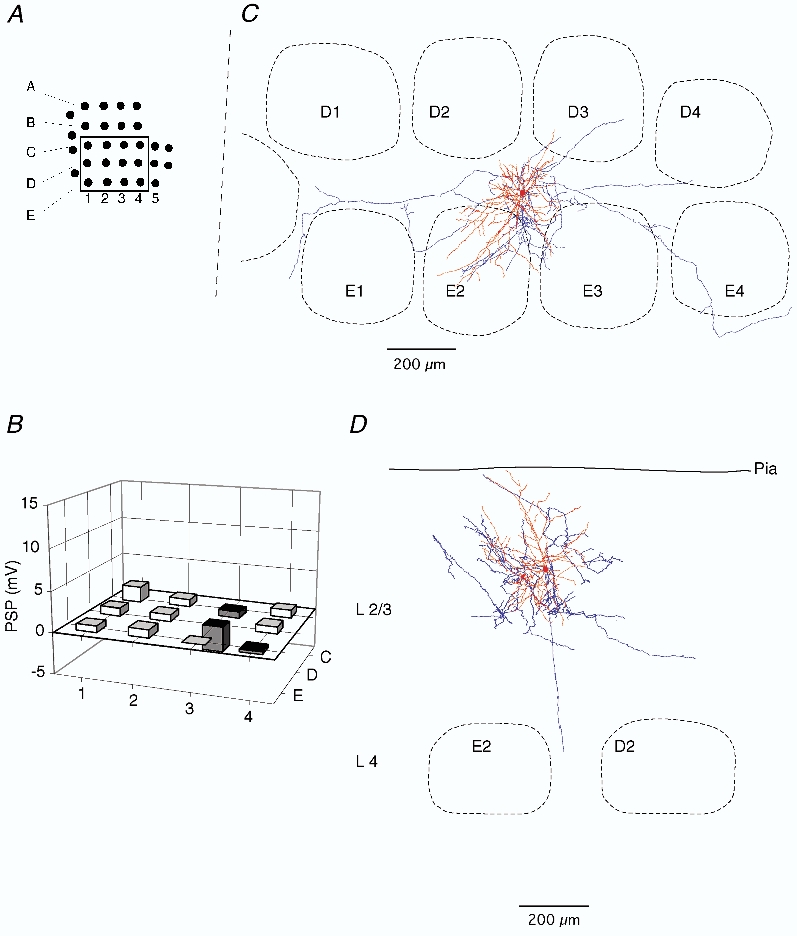
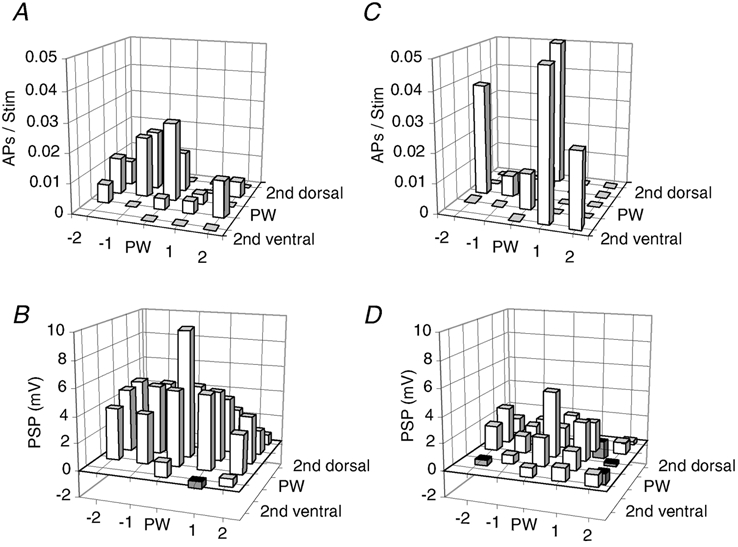
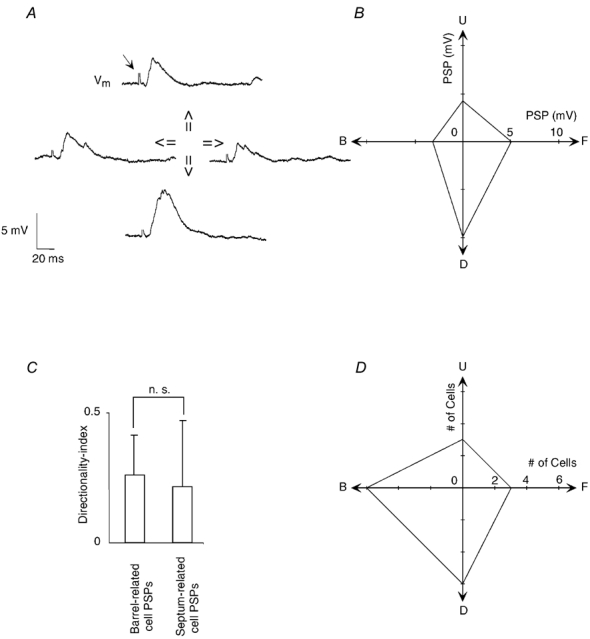
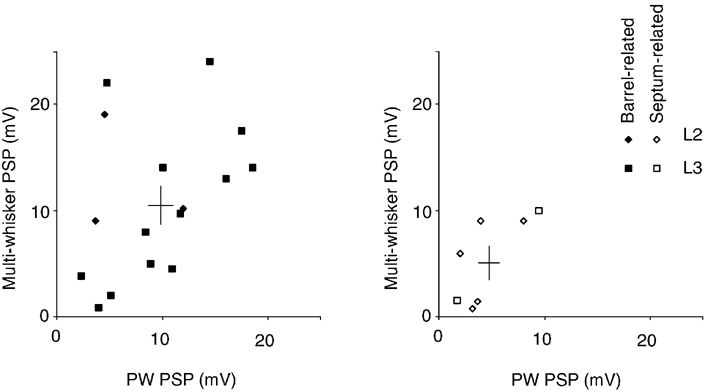
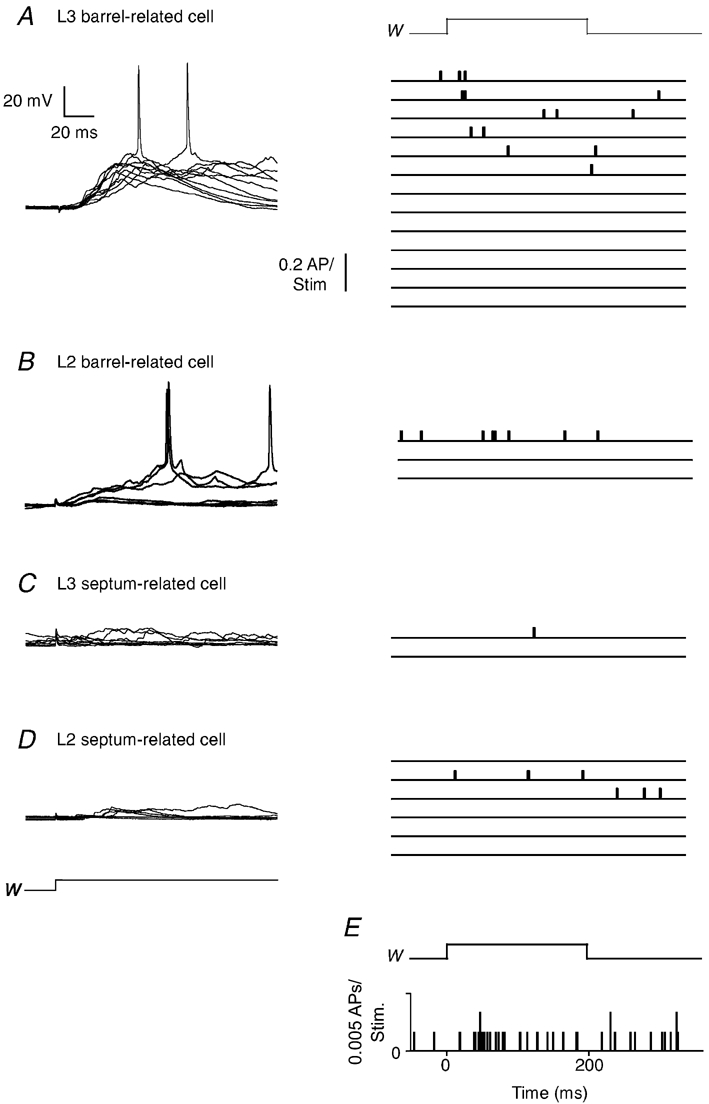
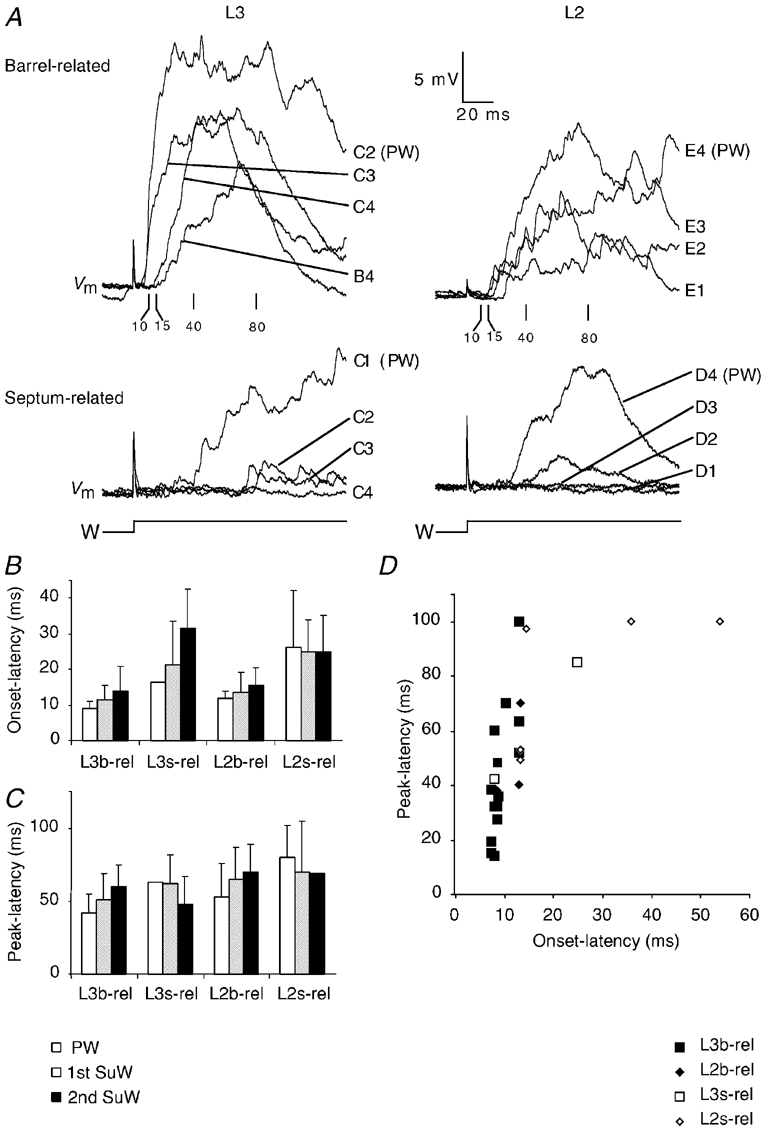
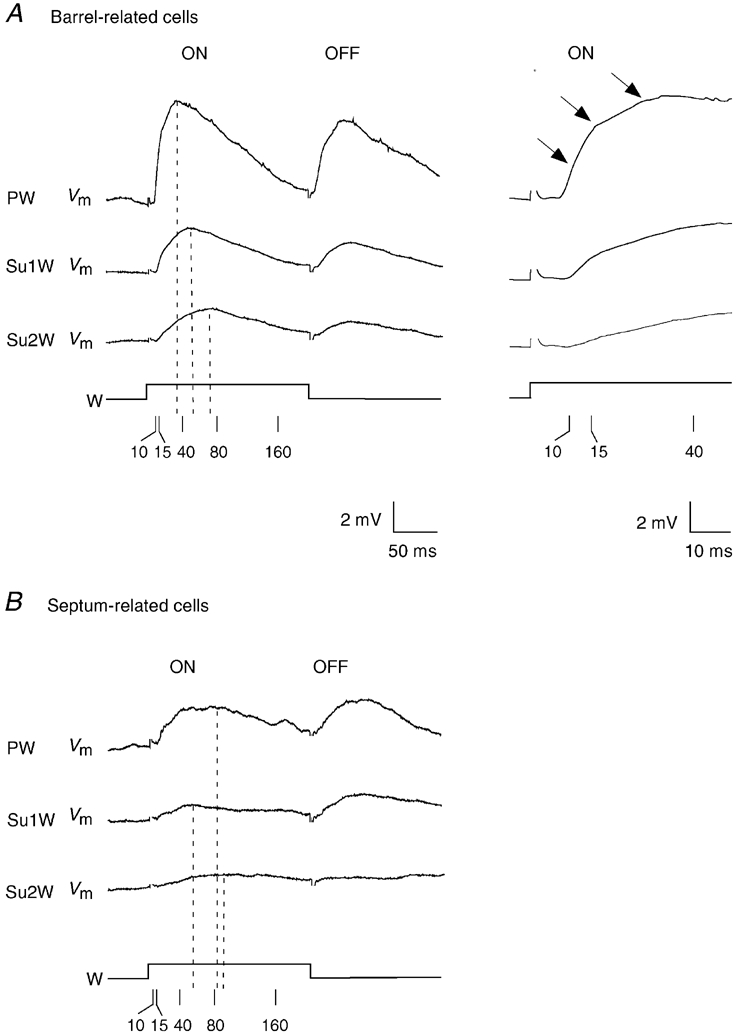
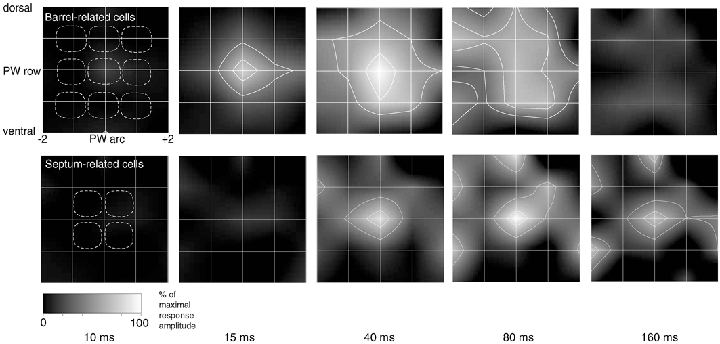
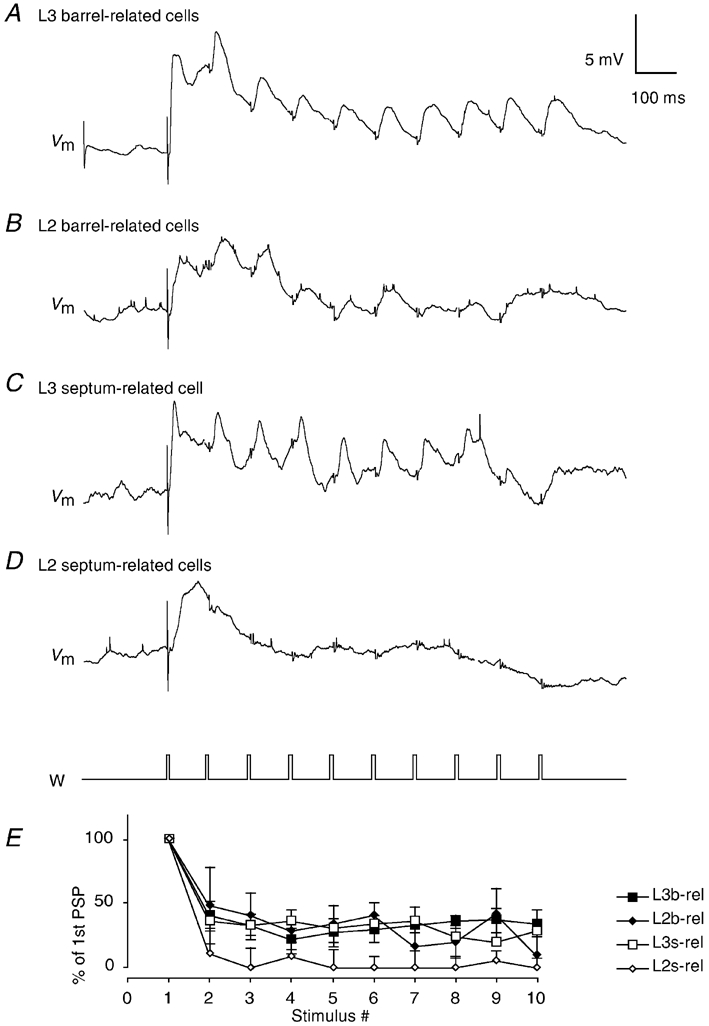
Whole-cell voltage recordings were made in vivo from subsequently reconstructed pyramidal neurons (n = 30) in layer 3 (L3) and layer 2 (L2) of the barrel cortex of urethane-anaesthetised rats. Average resting membrane potentials were well below (15-40 mV) action potential (AP) initiation threshold. The average spontaneous AP activity (0.068 +/- 0.22 APs s-1) was low. Principal whisker (PW) deflections evoked postsynaptic potentials (PSPs) in almost all cells of a PW column but evoked AP activity (0.031 +/- 0.056 APs per PW stimulus 6 deg deflection) was low indicating 'sparse' coding by APs. Barrel-related cells (n = 16) have their soma located above a barrel and project their main axon through the barrel whereas septum-related cells (n = 8) are located above and project their main axon through the septum between barrels. Both classes of cell had broad subthreshold receptive fields (RFs) which comprised a PW and several (> 8) surround whiskers (SuW). Barrel-related cells had shorter PSP onset latencies (9.6 +/- 4.6 ms) and larger amplitude PW stimulus responses (9.1 +/- 4.5 mV) than septum-related cells (23.3 +/- 16.5 ms and 5.0 +/- 2.8 mV, respectively). The dendritic fields of barrel-related cells were restricted, in the horizontal plane, to the PW column width. Their axonal arbors projected horizontally into several SuW columns, preferentially those representing whiskers of the same row, suggesting that they are the major anatomical substrate for the broad subthreshold RFs. In barrel-related cells the response time course varied with whisker position and subthreshold RFs were highly dynamic, expanding in size from narrow single-whisker to broad multi-whisker RFs, elongated along rows within 10-150 ms following a deflection. The response time course in septum-related cells was much longer and almost independent of whisker position. Their broad subthreshold RF suggests that L2/3 cells integrate PSPs from several barrel columns. We conclude that the lemniscal (barrel-related) and paralemniscal (septum-related) afferent inputs remain anatomically and functionally segregated in L2/3.


Figures

Figure 6
Figure 6. Sub- and suprathreshold RF map and dendritic and axonal segment density plots of L2/3 barrel-related pyramids
A1, average subthreshold (PSP) RF map for barrel-related cells (n = 16). The black grid indicates whisker positions, given with respect to the PW. Surround whisker positions are given by the intersection of horizontal and vertical lines. The number -2 refers to SuW located in the 2nd arc away from the PW in the caudal direction. The number +2 indicates whiskers in the second arc away from the PW in the rostral direction. ‘dorsal’, whisker positions on the whisker pad above the PW; ‘ventral’, whisker positions below the PW. The response amplitude is encoded by the brightness normalised to the peak of the PW deflection amplitude as determined in each individual experiment. The black contour line delineates an area on the RF map responding with > 50 % of the PW peak response amplitude. Outline of an average cytoarchitectonic L4 barrel field pattern (white dashed lines) in the horizontal plane is superimposed for comparison of the idealised columnar architecture with the average RF. Outlines above the PW barrel correspond to barrels located laterally. Outlines right to the PW barrel outline correspond to barrels located anterior to the PW barrel. A2, average suprathreshold (AP) RF map; conventions as in A1. B, average 2-D map of ‘dendritic length’ density (red, n = 9) projected onto a horizontal plane. An average barrel field projected into the horizontal plane (white dashed lines) is superimposed for comparison. Convention on location of barrels as in A. The inner white contour line delineates an area that contains densities that are equal to or larger than 50 % of the maximal density of dendrite segments. The outer white contour line delineates an area that includes 80 % of all dendritic segments. C, average 2-D map of ‘axon length’ density (blue, n = 8) projected onto a horizontal plane. Barrel field structure and white contour lines as described in B for dendritic segments. D, average 2-D map of dendritic length density (red, n = 12) projected onto a vertical plane. The dashed lines represent outlines of idealised averaged barrels. The outlines to the right of the PW barrel correspond to barrels located lateral to the PW barrel. White lines are contour lines as described in B. Continuous white line indicates approximate location of the pial surface. E, average 2-D map of axon length density (blue, n = 11). Projection onto a vertical, coronal plane along the arcs. Barrel outlines as in D, white lines are contour lines as described in B. Continuous white line indicates the pial surface. Cells reconstructed from tangential sections entered both horizontal and vertical projections, but cells reconstructed from coronal sections were used only in vertical projections (see Methods). Data from L3 and L2 cells are pooled.
Figure 7
Figure 7. Comparison of subthreshold RF map and dendrite and axon segment density plots of septum-related pyramids
A, average subthreshold (PSP) RF map for septum-related cells (n = 8). The black grid indicates whisker positions, given with respect to the PW. Surround whisker positions are given by intersection of horizontal and vertical lines. The number -2 refers to SuW located in the 2nd arc away from the PW in the caudal direction. The number +2 indicates whiskers in the second arc away from the PW in the rostral direction. ‘dorsal’, whisker positions on the whisker pad above the PW; ‘ventral’, whisker positions below the PW. The response amplitude is encoded by the brightness normalised to the peak of the PW deflection amplitude as determined in each individual experiment. The black contour line delineates an area on the RF map responding with > 50 % of the PW peak response amplitude. An average cytoarchitectonic L4 barrel field pattern (white dashed lines) in the horizontal plane is superimposed for comparison of the average RF structure of a barrel cell with the cytoarchitectonic barrel structure. Outlines above the PW barrel correspond to barrels located laterally of the PW barrel. Outlines to the right of the PW barrel outline correspond to barrels located anterior to the PW barrel. B, average 2-D map of ‘dendritic length’ density (red, n = 6) projected onto a horizontal plane. An average cytoarchitectonic barrel field projected into the horizontal plane (white dashed lines) is superimposed for comparison with dendritic density map and barrel structure. Convention on location of barrels as in A. The inner white contour line delineates an area that contains densities that are equal to or larger than 50 % of the maximal density of dendrite segments. The outer white contour line delineates an area that includes 80 % of all dendritic segments. C, average 2-D map of ‘axon length’ density (blue, n = 6) projected onto a horizontal plane. Barrel field structure and white contour lines as described in B for dendritic segments. D, average 2-D map of dendritic length density (red, n = 7) projected onto a vertical plane. The dashed lines represent outlines of averaged barrels. The outlines to the right of the PW barrel correspond to barrels located lateral to the PW barrel. White lines are contour lines as described in B. Continuous white line indicates the approximate location of the pial surface. E, average 2-D map of axon length density (blue, n = 7). Projection onto a vertical, coronal plane along the arcs. Barrel outlines as in D; white lines are contour lines as described in B. Continuous white line indicates the pial surface. Cells reconstructed from tangential sections entered both horizontal and vertical projections, but cells reconstructed from coronal sections were used only in vertical projections (see Methods). Data from L3 and L2 cells were pooled.
Figure 1
Figure 1. Sensory responses of a barrel-related pyramidal cell in L3
A, left: schematic representation of the whisker arrangement in the rat's face. A, right: horizontal projection of dendritic (red) and axonal arbors (blue) relative to the position of barrels in L4 of the L3 pyramidal cell. The cell was reconstructed from tangential sections. B, stimulation of principal whisker (PW, w C2). Upper traces: two successive responses (Vm) to PW deflection. The average membrane potential response (20 trials) is shown in the lower trace. Time course of whisker deflection (w C2) is shown schematically below the membrane potential records. C, stimulation of surround whisker (SuW, w D2). Two successive responses (Vm) to a surround whisker (w D2) deflection and averaged response (20 trials). Onset and offset stimulus artefacts appear in all records as small upward and downward deflections. Calibration bars refer to B and C. D, spontaneous subthreshold activity of the same neuron. The membrane potential fluctuated between hyperpolarised potentials (down-states), during which little or no synaptic background activity was observed, and 10-20 mV more depolarised membrane states (up-states) with synaptic background activity.
Figure 2
Figure 2. Subthreshold RF map and dendritic and axonal arborisation of a barrel-related pyramid in L3
A, schematic drawing of the position of mapped whiskers. The box delineates those whiskers,that were deflected and whose Vm responses were quantified. B, subthreshold peak response to deflection onset of the whiskers shown in A. Height of each bar represents mean amplitude of the response. Position of the whisker is identified by the intersection of arc lines (1-4) and row lines (B-D). C, dendritic (red) and axonal (blue) arbors of the cell recorded from, when projected onto the horizontal plane, shown relative to barrel borders in the horizontal plane. D, same reconstruction projected onto a vertical plane, parallel to arc 2 (the projection plane is indicated in C by the dashed line). The cell was reconstructed from tangential sections.
Figure 3
Figure 3. Subthreshold RF map and arborisation of a barrel-related cell in L2
A, position of mapped whiskers. The box delineates those whiskers whose Vm responses were quantified. B, subthreshold peak response to deflection onset of different whiskers. Height of each bar represents the mean peak amplitude. Position of the whisker is identified by the intersection of arc and row lines, as in Fig. 2. C, dendritic (red) and axonal (blue) arbors of the cell recorded from, when projected onto the horizontal plane, shown relative to barrel borders in the horizontal plane. D, same reconstruction projected onto a vertical plane, parallel to arc 2 (the projection plane is indicated in C by the dashed line). The cell was reconstructed from coronal sections.
Figure 4
Figure 4. Subthreshold RF map and arborisation of a septum-related cell in L3
A, position of mapped whiskers. The box delineates those whiskers whose Vm responses were quantified. B, subthreshold peak response to deflection onset of different whiskers. Height of each bar represents the mean peak amplitude. Position of the whisker is identified by the intersection of arc and row lines, as in Fig. 2. C, dendritic (red) and axonal (blue) arbors of the cell recorded from, when projected onto the horizontal plane, shown relative to barrel borders in the horizontal plane. D, same reconstruction projected onto a vertical plane, parallel to arc 2 (the projection plane is indicated in C by the dashed line). The cell was reconstructed from tangential sections.
Figure 5
Figure 5. Subthreshold RF map and arborisation of a septum-related cell in L2
A, position of mapped whiskers. The box delineates those whiskers whose Vm responses were quantified. B, subthreshold peak response to deflection onset of different whiskers. Height of each bar represents the mean peak amplitude. Position of the whisker is identified by the intersection of arc and row lines, as in Fig. 2. C, dendritic (red) and (blue) axonal arbors of the cell recorded from, when projected onto the horizontal plane, shown relative to barrel borders in the horizontal plane. D, same reconstruction projected onto a vertical plane, parallel to arc 2 (the projection plane is indicated in C by the dashed line). The cell was reconstructed from tangential sections.
Figure 8
Figure 8. Comparison of averaged sub- and suprathreshold RF maps
A, average suprathreshold (AP) RF map for barrel-related cells (n = 16). Prior to averaging RFs were aligned to the PW position determined by the subthreshold RF map. The position of a whisker is given by the intersection of horizontal and vertical lines. APs refers to average number of APs per deflection. B, average subthreshold (PSP) RF map for barrel-related cells (n = 16). C, average suprathreshold (AP) RF map for septum-related cells (n = 7). D, average subthreshold (PSP) RF map for septum-related cells (n = 5). To reveal the differential responsiveness of barrel and septum cells, the top two (A and C) and the bottom two graphs (B and D) have the same scale. Note that the plot shown in C is based on a small number of responses and is thus very noisy. B-D, conventions as in A.
Figure 9
Figure 9. Responses to stimuli from different directions
A, subthreshold responses of a barrel-related L3 pyramidal cell to varying stimulus directions. The stimulation artefact seen in all traces is indicated by the small arrow in the uppermost trace. B, direction tuning of PSPs, same cell as in A. Same scale for x- and y-axis. C, directionality indices for PSPs for all supragranular cells tested (n = 16). Unity value represents completely directional responses, value of 0 represent completely non-directional responses. Error bars represent 1 s.d.D, direction preferences of all recorded cells, convention for direction as in B. Same scale for x- and y-axis.
Figure 10
Figure 10. Responses to single- and multi-whisker stimulation
Left: barrel-related cells. Plot of multi-whisker response vs. PW response (n = 16). The two bars indicate the means ± s.e.m. Right: septum-related cells. Plot of multi-whisker response vs. PW response (n = 8).
Figure 11
Figure 11. Suprathreshold responses of barrel- and septum-related cells
A, left: records of 10 superimposed responses of a barrel-related cell to PW deflection. Right: peristimulus time histograms (PSTHs) of 13 L3 barrel-related cells. Bin width of PSTHs is 0.5 ms. B, left: responses of a L2 barrel-related cell. Right: PSTHs of 3 L2 barrel-related cells. C, left: responses of a L3 septum-related cell. Right: PSTHs of 2 L3 septum-related cells. D, left responses of a L2 septum-related cell. Right: PSTHs of 6 L2 septum-related cells. E, population PSTHs of all cells (n = 30). Time course of PW deflection is above the PSTH (W).
Figure 12
Figure 12. Latencies and time course of responses to PW and SuW deflection
A, responses of barrel-related cells (upper family of traces) and septum-related cells (lower family of traces). Numbers below upper family of traces refer to poststimulus time (ms). B, onset latency differences to PW and SuW stimulation. Means ± s.d.C, peak latency differences to PW and SuW stimulation. Means ± s.d.D, plot of PW onset latencies against PW peak latencies. b-rel, barrel-related cells; s-rel, septum-related cells.
Figure 13
Figure 13. Average membrane potential changes after PW and SuW deflection in barrel-related and septum-related cells
A, top left: average of all barrel-related cell (n = 16) onset and offset responses to PW, and first (Su1W) and second (Su2W) order SuW deflection. Top right: onset responses at higher temporal resolution. The arrows point to temporally distinct response components. B, average of all septum-related cell (n = 8) onset and offset responses to PW, and first (Su1W) and second (Su2W) order SuW deflection. Calibration as in A, left panel. Stimulus artefacts in A and B are partially blanked.
Figure 14
Figure 14. Time dependence of subthreshold RF structure
Subthreshold RFs plots. The grid of white lines represents the localisation of a whisker with respect to the PW as the intersection between horizontal and vertical lines. Response amplitudes are normalised with respect to the response to PW stimulation. The dashed white lines delineate the outlines of average anatomical barrels arranged around the PW barrel. Barrel representation as in Figs 6 and 7. Top panel: averaged and smoothed subthreshold RFs of barrel-related cells (n = 5) at different times ranging from 10 to 160 ms after whisker deflection. The same grey scaling applies to all RF plots. The white lines delineate the area of > 80 % and > 50 % of the maximal response to PW stimulation (maximal response at 15-20 ms for barrel cells and at 40 ms for septum cells). For clarity, the contour lines are shown only in those RF plots where the response reaches at least 50 % of the maximal amplitude. Bottom panel: time-resolved subthreshold RF plots for 5 septum-related cells (n = 5).
Figure 15
Figure 15. Responses to repetitive PW deflections (10 Hz trains)
Stimuli were brief (2 ms) back and forth deflections (6 deg) applied at 10 Hz. All but the first needle-like stimulation artefacts in the respective traces (Vm) have been blanked. A, average response of 8 L3 barrel-related cells (average of 20 stimulation trials per cell) to repetitive stimuli. B, average response of 3 barrel-related L2 cells (average of 20 stimulation trials per cell). C, response of a septum-related L3 cell (average of 20 stimulation trials). D, response of 3 septum-related L2 cells (average of 20 stimulation trials per cell). E, average short-term modification of EPSPs during repetitive (10 Hz) deflection of whiskers in 4 classes of L2/3 neuron. Baseline to peak amplitudes are plotted. Only depolarising responses were quantified here, because with repetitive stimuli IPSPs cannot be distinguished from decaying excitatory responses. Means ± s.d.

Similar articles

Cited by

References

    1. Ahissar E, Sosnik R, Bagdasarian K, Haidarliu S. Temporal frequency of whisker movement. II. Laminar organization of cortical representations. J Neurophysiol. 2001;86:354–367. - PubMed
    1. Armstrong-James M. The nature and plasticity of sensory processing within adult rat barrel cortex. In: Jones EG, Diamond IT, editors. The Barrel Cortex of Rodents. New York: Plenum Press; 1995. pp. 333–374.
    1. Armstrong-James M, Fox K. Spatio-temporal divergence and convergence in the rat "barrel" cortex. J Comp Neurol. 1987;263:265–281. - PubMed
    1. Armstrong-James M, Fox K, Das-Gupta A. Flow of excitation within rat barrel cortex on striking a single vibrissa. J Neurophysiol. 1992;68:1345–1358. - PubMed
    1. Arnold PB, Li CX, Waters RS. Thalamocortical arbors extend beyond single cortical barrels: an in vivo tracing study in the rat. Exp Brain Res. 2001;136:152–168. - PubMed

LinkOut - more resources