. 2003 Sep 16;100(19):11116-21.
doi: 10.1073/pnas.1434381100. Epub 2003 Aug 29.

Nitric oxide regulates K+ and Cl- channels in guard cells through a subset of abscisic acid-evoked signaling pathways

Affiliations

Nitric oxide regulates K+ and Cl- channels in guard cells through a subset of abscisic acid-evoked signaling pathways

Carlos Garcia-Mata et al. Proc Natl Acad Sci U S A. .

Abstract

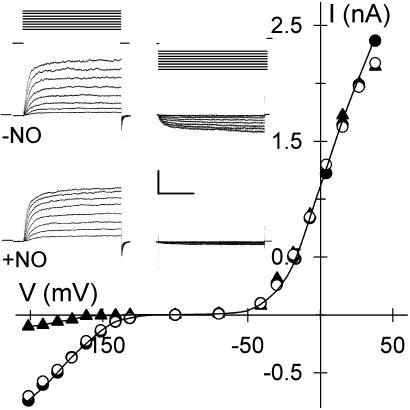
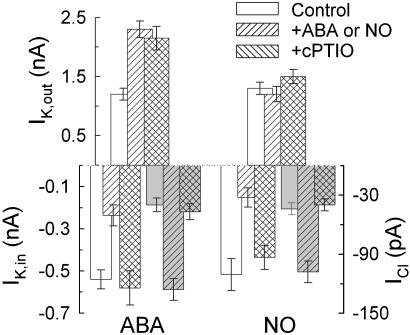
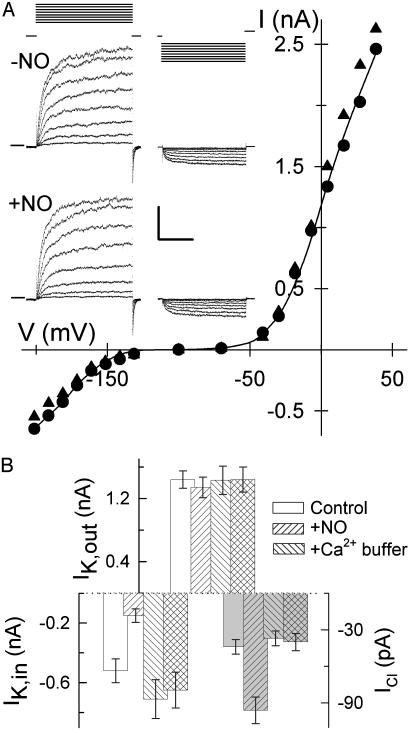
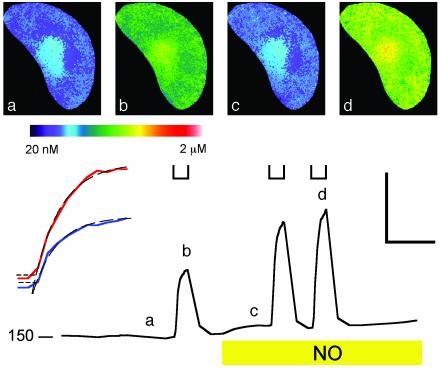
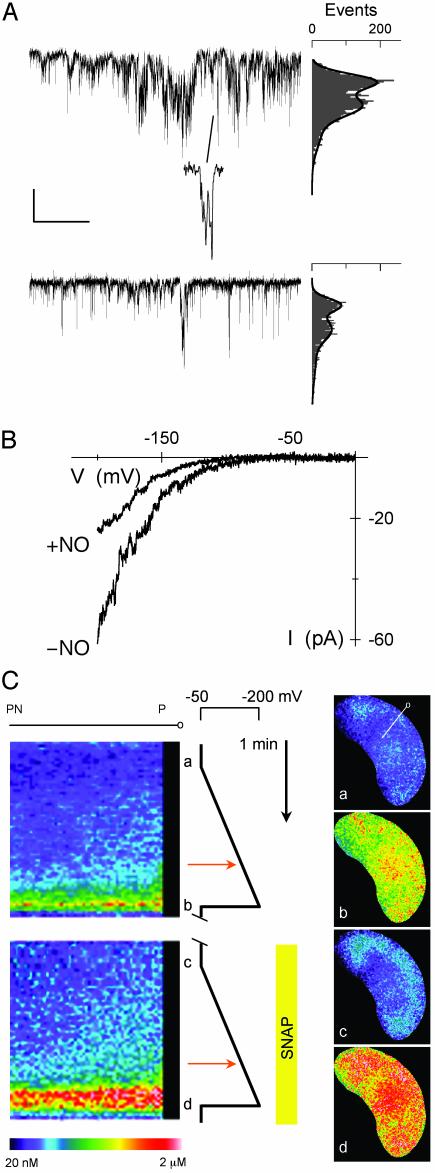
Abscisic acid (ABA) triggers a complex sequence of signaling events that lead to concerted modulation of ion channels at the plasma membrane of guard cells and solute efflux to drive stomatal closure in plant leaves. Recent work has indicated that nitric oxide (NO) and its synthesis are a prerequisite for ABA signal transduction in Arabidopsis and Vicia guard cells. Its mechanism(s) of action is not well defined in guard cells and, generally, in higher plants. Here we show directly that NO selectively regulates Ca2+-sensitive ion channels of Vicia guard cells by promoting Ca2+ release from intracellular stores to raise cytosolic-free [Ca2+]. NO-sensitive Ca2+ release was blocked by antagonists of guanylate cyclase and cyclic ADP ribose-dependent endomembrane Ca2+ channels, implying an action mediated via a cGMP-dependent cascade. NO did not recapitulate ABA-evoked control of plasma membrane Ca2+ channels and Ca2+-insensitive K+ channels, and NO scavengers failed to block the activation of these K+ channels evoked by ABA. These results place NO action firmly within one branch of the Ca2+-signaling pathways engaged by ABA and define the boundaries of parallel signaling events in the control of guard cell movements.


Figures

Fig. 1.
Fig. 1.
NO selectively inactivates IK,in. Voltage-clamp recordings from an intact Vicia guard cell are shown. (Inset) Steady-state current–voltage curves determined from voltage-clamp steps before (•), after 2 min of exposure to 10 μM SNAP (▴), and after 6 min of washing in buffer-SNAP (○). K+-channel currents were obtained by subtracting instantaneous current from steady-state current at each voltage. Data for IK,in and IK,out were fitted jointly (solid lines) to common Boltzmann functions (20, 24) with the voltage sensitivity parameter V1/2, the voltage giving half-maximal conductance, free to vary between curves. Values for V1/2 (IK,in): -NO, -173 ± 4 mV; +NO, -192 ± 9 mV. (Inset) Current traces for IK,out (Left) and IK,in (Right) before (Middle) and during (Bottom) NO treatment. Zero current is indicated on the left. Voltage protocols (Top) of steps between -200 and +50 mV from holding voltage of -100 mV are shown. (Scale: horizontal, 2 s; vertical, 1 nA.)
Fig. 2.
Fig. 2.
NO scavenger cPTIO blocks inactivation of IK,in and activation of ICl by ABA and NO but not ABA-mediated activation of IK,out. Steady-state current determined as described for Fig. 1 for IK,out at +30 mV, IK,in at -200 mV, and ICl at -70 mV (shaded bars) (21) summarizes effects of a 10-min exposure to ABA with (n = 9) or without 20 μM cPTIO (n = 8) (Left) and to 10 μM SNAP with (n = 7) or without 20 μM cPTIO (n = 27) (Right).
Fig. 3.
Fig. 3.
Ca2+ buffering blocks NO inactivation of IK,in and activation of ICl. (A) Voltage-clamp recordings from an intact Vicia guard cell impaled and buffer-loaded from a microelectrode containing 50 mM 1,2-bis(2-aminophenoxy)ethane-N,N,N′,N′-tetraacetate (BAPTA). Shown are steady-state current–voltage curves determined from voltage-clamp steps (Inset) before (•) and after 6 min of exposure to 10 μM SNAP (▴) as described for Fig. 1. Data for IK,in and IK,out fitted jointly (solid lines) to common Boltzmann functions (see Fig. 1) gave half-maximal conductance for IK,in of -178 ± 3mV(-NO) and -181 ± 4mV(+NO). (Inset) Current traces for IK,out (Left) and IK,in (Right) before (Middle) and during (Bottom) NO treatment. Zero current is indicated on the left. Voltage protocols (Top) of steps between -200 mV and +50mV from holding voltage of -100 mV. (Scale: horizontal, 2 s; vertical, 1 nA.) (B) Summary of IK,out, IK,in, and ICl (shaded bars) before and after exposure to 10 μM SNAP with (n = 10) and without (n = 27) 50 mM EGTA or 50 mM BAPTA loading. Currents were determined as described for Figs. 1 and 2.
Fig. 4.
Fig. 4.
NO promotes evoked [Ca2+]i increases without affecting [Ca2+]i recovery. (Lower) [Ca2+]i recorded from one guard cell clamped to -50 mV and stepped to -200 mV at time periods indicated ([unionsq]) before and after adding 10 μM SNAP show enhanced [Ca2+]i rise but no apparent change in recovery kinetics at -50 mV. (Lower Left) [Ca2+]i basal level in nM. Fura 2 fluorescence images taken at 2-s intervals. (Upper) Selected ratio images (a–d) correspond to the time points indicated. (Lower Left Inset) Expanded analysis of [Ca2+]i rise from 2 s before -200 mV steps. -NO (blue) and +NO (red) show no change in lag time. The data points above +1 SD from mean [Ca2+]i before clamp step (horizontal dashed lines) fitted to single exponentials gave equivalent lag periods and rise half-times of 4.2 s despite the difference in amplitudes. [Scale: horizontal, 1 min (Lower Left Inset, 10 s); vertical 400 nM.]
Fig. 5.
Fig. 5.
NO enhances evoked [Ca2+]i increases without promoting Ca2+-channel activity at the plasma membrane. (A) Cell-attached, single Ca2+-channel records from one guard cell protoplast before (Top) and 2 min after (Bottom) adding 10 μM SNAP. (Middle) Expanded time scale showing single opening events. [Scale: horizontal, 1 s (50 ms, Middle); vertical, 2 pA.] Point-amplitude histograms (Right), which plot the number of openings and their mean amplitude (the vertical axis is scaled to traces) for 10-s periods, including segments shown, indicate an ≈2-fold decrease in opening events. (B) Whole-cell Ca2+ currents recorded during voltage ramps before and 2 min after adding 10 μM SNAP (see ref. 18). (C) Kymograph (Left) of voltage evoked [Ca2+]i rise in one intact guard cell recorded by fura 2 fluorescence ratio at 2-s intervals before and 2 min after adding 10 μM SNAP. The time line (Center) runs top to bottom with voltage scale and ramps as indicated. Selected ratio images (Right,a–d) correspond to time points indicated. The kymograph was constructed from successive ratio images averaged over a 2-pixel-wide band (line in Right, a) from cell exterior and periphery (P) to the perinuclear region (PN). Voltage ramps from -50 mV to -200 mV over 90 s. The threshold for [Ca2+]i rise was determined as time of [Ca2+]i rise 1 SD above the pre-ramp level to a depth of 3 pixel units (≈2 μm). Thresholds (red arrows, Center): -NO, -138 mV; +SNAP, -143 mV.

Similar articles

Cited by

References

    1. Gibson, A. D. & Garbers, D. L. (2000) Annu. Rev. Neurosci. 23, 417-439. - PubMed
    1. Stamler, J. S. (1994) Cell 78, 931-936. - PubMed
    1. Ahern, G. P., Klyachko, V. A. & Jackson, M. B. (2002) Trends Neurosci. 25, 510-517. - PubMed
    1. Renganathan, M., Cummins, T. R. & Waxman, S. G. (2002) J. Neurophysiol. 87, 761-775. - PubMed
    1. Tang, X. D., Daggett, H., Hanner, M., Garcia, M. L., Mcmanus, O. B., Brot, N., Weissbach, H., Heinemann, S. H. & Hoshi, T. (2001) J. Gen. Physiol. 117, 253-273. - PMC - PubMed

Publication types

MeSH terms

LinkOut - more resources