Review
. 2003;4(9):117.
doi: 10.1186/gb-2003-4-9-117. Epub 2003 Aug 29.

Comparing protein abundance and mRNA expression levels on a genomic scale

Affiliations
Review

Comparing protein abundance and mRNA expression levels on a genomic scale

Dov Greenbaum et al. Genome Biol. 2003.

Abstract

Attempts to correlate protein abundance with mRNA expression levels have had variable success. We review the results of these comparisons, focusing on yeast. In the process, we survey experimental techniques for determining protein abundance, principally two-dimensional gel electrophoresis and mass-spectrometry. We also merge many of the available yeast protein-abundance datasets, using the resulting larger 'meta-dataset' to find correlations between protein and mRNA expression, both globally and within smaller categories.


Figures
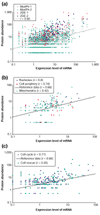
Figure 1
Figure 1
Comparison of mRNA expression and protein abundance. (a) A plot comparing our mRNA reference expression set [29] with our newly compiled protein abundance dataset. The mRNA axis is in copies per cell; the protein axis is in thousand copies per cell. The protein dataset is the result of iteratively fitting two MudPit datasets (MudPit-1 [32] and MudPit-2 [31]) and two two-dimensional electrophoresis datasets (2DE-1 [7] and 2DE-2 [28]). Given the semi-quantitative nature of the MudPit data [31], we transformed the data into a more quantitative set by fitting each set individually onto our reference mRNA expression dataset. In addition, we fit the MudPit-1 dataset onto the more finely-grained MudPit-2 dataset. Each of the datasets was then moved back into 'protein space' using an inverse transformation derived from the 2DE-1 set, as this set has the most precise values. These datasets were then combined into the new reference abundance dataset. In cases in which there were overlapping values for a given ORF we used the dataset in accord with the following ordering: 2DE-1, 2DE-2, MudPit-2, MudPit-1. The resulting reference protein abundance dataset (N = 2044) had a correlation of 0.66 with the mRNA reference dataset. (b,c) Additionally, we show that when looking at specific subsets (subcellular localization [52] or functional groups [34,35]) we can find both higher and lower correlations amongst these groups. The lower correlations are generally reflective of a more heterogeneous category. This analysis indicates that while correlations may be weak when looking at the global data, we tend to find higher correlations when looking at smaller well-defined subsets of ORFs. Further analysis is available at [33].
Figure 2
Figure 2
The differences in correlation between mRNA and protein expression values using novel categories. We see significant differences when looking at the highest and lowest ranking of groups of ORFs in the following categories: occupancy, CAI (codon adaptation index) value [45-47] and variability. Occupancy refers to the percentage of transcripts associated with ribosomes; we compared the correlation between the top 100 ORFs and the bottom 100 in terms of occupancy (r = 0.78 versus 0.30). For the CAI, we compared the correlation between mRNA and protein for those ORFs with the highest CAI and those with the lowest (r = 0.48 versus 0.02). Variability refers to the normalized standard deviation (that is, the standard deviation divided by the average expression level) for all ORFs in the cell-cycle expression dataset of Cho et al. [38]. Here, we compared the correlations between protein abundance and mRNA expression for the most variable compared with the least variable proteins (r = 0.89 versus 0.20). We found significant differences between the correlations of mRNA and protein levels for the top and bottom ranking populations for each of the comparisons.

References

    1. O'Farrell PH. High resolution two-dimensional electrophoresis of proteins. J Biol Chem. 1975;250:4007–4021. - PMC - PubMed
    1. Klose J. Protein mapping by combined isoelectric focusing and electrophoresis of mouse tissues. A novel approach to testing for induced point mutations in mammals. Humangenetik. 1975;26:231–243. - PubMed
    1. Hatzimanikatis V, Choe LH, Lee KH. Proteomics: theoretical and experimental considerations. Biotechnol Prog. 1999;15:312–318. - PubMed
    1. Schena M, Heller RA, Theriault TP, Konrad K, Lachenmeier E, Davis RW. Microarrays: biotechnology's discovery platform for functional genomics. Trends Biotechnol. 1998;16:301–306. - PubMed
    1. McGall GH, Christians FC. High-density genechip oligonucleotide probe arrays. Adv Biochem Eng Biotechnol. 2002;77:21–42. - PubMed

LinkOut - more resources