Comparative Study
. 2003 Sep;13(9):2082-91.
doi: 10.1101/gr.1186603.

Pleiotropy, homeostasis, and functional networks based on assays of cardiovascular traits in genetically randomized populations

Affiliations
Comparative Study

Pleiotropy, homeostasis, and functional networks based on assays of cardiovascular traits in genetically randomized populations

Joseph H Nadeau et al. Genome Res. 2003 Sep.

Abstract

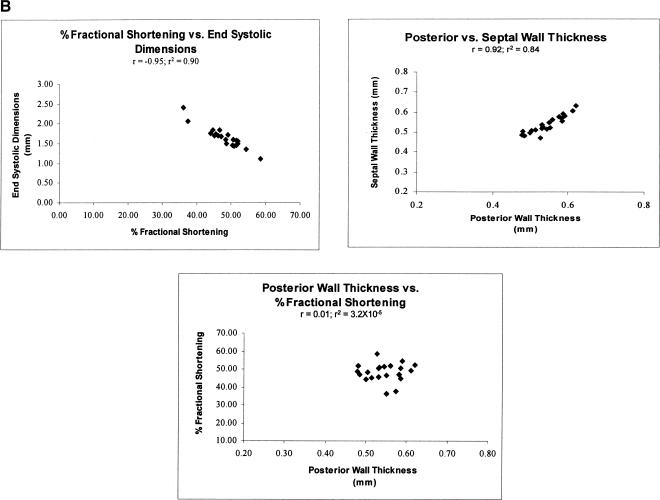
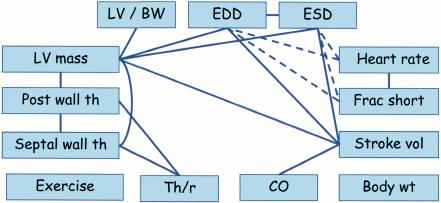
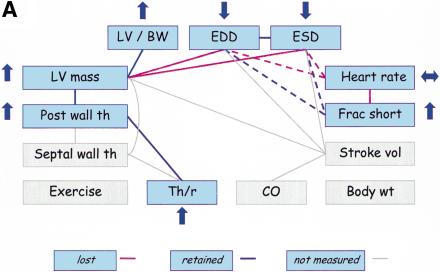
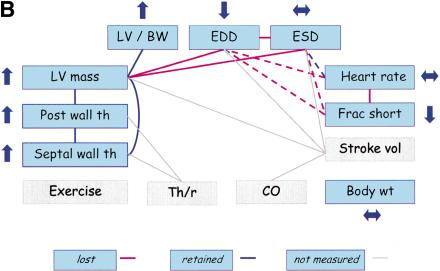
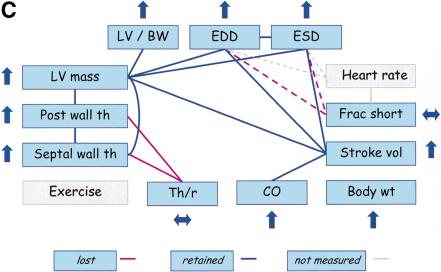
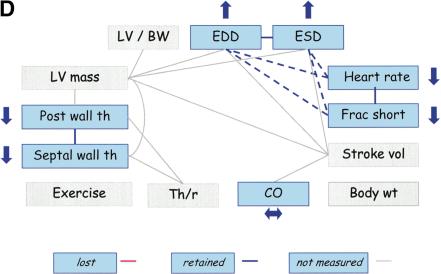
A major problem in studying biological traits is understanding how genes work together to provide organismal structures and functions. Conventional reductionist paradigms attribute functions to particular proteins, motifs, and amino acids. An equally important but harder problem involves the synthesis of data at fundamental levels of biological systems to understand functionality at higher levels. We used subtle, naturally occurring, multigenic variation of cardiovascular (CV) properties in a panel of genetically randomized strains that are derived from the A/J and C57BL/6J strains of mice to perturb CV functions in nonpathologic ways. In this proof-of-concept study, computational analysis correctly identified the known relations among CV properties and revealed functionality at higher levels of the CV system. The network was then used to account for pleiotropies and homeostatic responses in single gene mutant mice and in mice treated with a pharmacologic agent (anesthesia). The CV network accounted for functional dependencies in complementary ways to the insights obtained from genetic networks and biochemical pathways. These networks are therefore an important approach for defining and characterizing functional relations in complex biological systems in health and disease.


Figures

Figure 1
Figure 1
Anatomy of the left ventricle showing the various measurements and how they were used to calculate other measures of CV functions. (A) A schematic illustration of the heart showing the position of the transducer in transthoracic echocardiography. (B) A schematic illustration of an echocardiogram obtained with the transducer in the position shown in A. The wall thicknesses and left ventricular dimensions are labeled. (C) Concentric vs. eccentric hypertrophy. In concentric hypertrophy, wall thickness increases at the expense of cavity dimensions, so relative wall thickness increases, whereas in eccentric hypertrophy, wall thickness and cavity dimensions change proportionally, so relative wall thickness remains unchanged.
Figure 1
Figure 1
Anatomy of the left ventricle showing the various measurements and how they were used to calculate other measures of CV functions. (A) A schematic illustration of the heart showing the position of the transducer in transthoracic echocardiography. (B) A schematic illustration of an echocardiogram obtained with the transducer in the position shown in A. The wall thicknesses and left ventricular dimensions are labeled. (C) Concentric vs. eccentric hypertrophy. In concentric hypertrophy, wall thickness increases at the expense of cavity dimensions, so relative wall thickness increases, whereas in eccentric hypertrophy, wall thickness and cavity dimensions change proportionally, so relative wall thickness remains unchanged.
Figure 2
Figure 2
Frequency distributions and cosegregation patterns for selected CV traits. (A) Frequency distribution of mean values for selected CV traits among the AXB/BXA RI strains. The mean values for the parental strains are marked. (B) Cosegregation of selected CV traits among the 21 AXB/BXA RI strains.
Figure 2
Figure 2
Frequency distributions and cosegregation patterns for selected CV traits. (A) Frequency distribution of mean values for selected CV traits among the AXB/BXA RI strains. The mean values for the parental strains are marked. (B) Cosegregation of selected CV traits among the 21 AXB/BXA RI strains.
Figure 3
Figure 3
Cosegregation of CV traits among the AXB/BXA RI strains. Gray cells indicate statistically significant correlations (P < 0.05, after correction for multiple testing).
Figure 4
Figure 4
Network of CV traits. Solid lines indicate positive relationships and broken lines indicate inverse relationships. Abbreviations are described in the text.
Figure 5
Figure 5
Trait relationships in mutant mice with CV pathology and mice treated with anesthesia. Traits not measured in the studies are highlighted in gray. Upward arrows indicate that the mutant (or treated) mice had significantly higher trait values than wild-type (or untreated) mice, and downward arrows indicate that the mutant (or treated) mice had significantly lower trait values than wild-type (or untreated mice). Double-headed (horizontal) arrows indicate an insignificant difference between mutant (or treated) and wild-type (or untreated) mice. The red lines indicate the PSN relationships that do not appear to be present in mutant (or treated) mice. (A) Trait relationships for mice with cardiac-specific overexpression of calsequestrin. Ten–12-wk-old mice were anesthetized with 2.5% Avertin (Schmidt et al. 2000). (B) Trait relationships in transgenic mice with overexpression of protein kinase C β2 isoform in myocardium. Eleven-wk-old mice were anesthetized with 2.5% Avertin (Wakasaki et al. 1999) (C) Trait relationships in transgenic mice with reduced brown fat. Twelve-wk-old mice were anesthetized with ketamine and xylazine (Cittadini et al. 1999). (D) Trait relationships in conscious and anesthetized mice. Twelve-wk-old mice were analyzed without anesthesia or with 2.5% tribromoethanol (Kiatchoosakun et al. 2001).
Figure 5
Figure 5
Trait relationships in mutant mice with CV pathology and mice treated with anesthesia. Traits not measured in the studies are highlighted in gray. Upward arrows indicate that the mutant (or treated) mice had significantly higher trait values than wild-type (or untreated) mice, and downward arrows indicate that the mutant (or treated) mice had significantly lower trait values than wild-type (or untreated mice). Double-headed (horizontal) arrows indicate an insignificant difference between mutant (or treated) and wild-type (or untreated) mice. The red lines indicate the PSN relationships that do not appear to be present in mutant (or treated) mice. (A) Trait relationships for mice with cardiac-specific overexpression of calsequestrin. Ten–12-wk-old mice were anesthetized with 2.5% Avertin (Schmidt et al. 2000). (B) Trait relationships in transgenic mice with overexpression of protein kinase C β2 isoform in myocardium. Eleven-wk-old mice were anesthetized with 2.5% Avertin (Wakasaki et al. 1999) (C) Trait relationships in transgenic mice with reduced brown fat. Twelve-wk-old mice were anesthetized with ketamine and xylazine (Cittadini et al. 1999). (D) Trait relationships in conscious and anesthetized mice. Twelve-wk-old mice were analyzed without anesthesia or with 2.5% tribromoethanol (Kiatchoosakun et al. 2001).

Similar articles

Cited by

References

    1. Alonso-Blanco, C., Koornneef, M., and Stam, P. 1998. The use of recombinant inbred lines (RILs) for genetic mapping. Methods Mol. Biol. 82: 137–146. - PubMed
    1. Arkin, A., Shen, P., and Ross, J. 1997. A test case for correlation metric construction of a reaction pathway from measurements. Science 277: 1275–1279.
    1. Bailey, D.W. 1956. A comparison of genetic and environmental influences on the shape of the axis in mice. Genetics 41: 207–222. - PMC - PubMed
    1. ____. 1981. Recombinant inbred strains and bilineal congenic strains. In The mouse in biomedical research, Vol. 1. History, genetics and wild mice (eds. H.L. Foster et al.), pp. 223–239. Academic Press, New York.
    1. Brem, R.B., Yvert, G., Clinton, R., and Kruglyak, L. 2002. Genetic dissection of transcriptional regulation in budding yeast. Science 296: 752–755. - PubMed

WEB SITE REFERENCES

    1. http://www.jax.org/staff/churchill/labsite/dataset/index.html; Raw data in tab delineated format along with a script that can be executed in a Matlab (Mathworks Inc., Natick, MA) session to replicate the analyses described in this article.

Publication types

LinkOut - more resources