. 2003 Sep;13(9):2118-28.
doi: 10.1101/gr.771603.

Assessment of genome-wide protein function classification for Drosophila melanogaster

Affiliations

Assessment of genome-wide protein function classification for Drosophila melanogaster

Huaiyu Mi et al. Genome Res. 2003 Sep.

Abstract

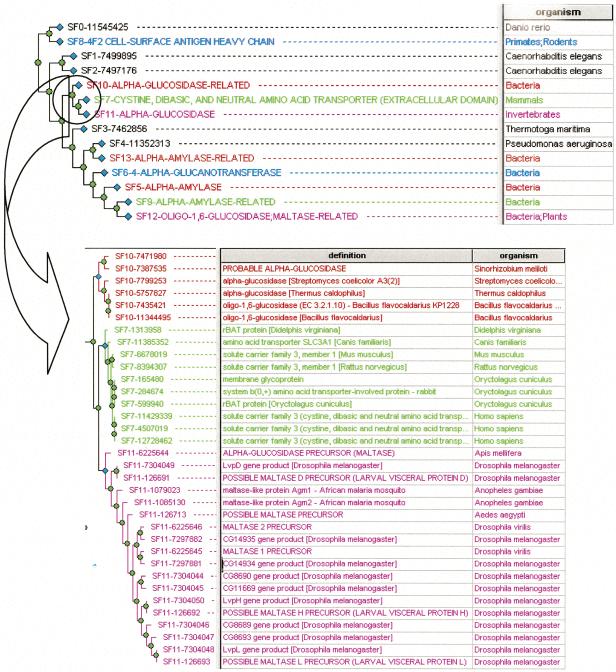
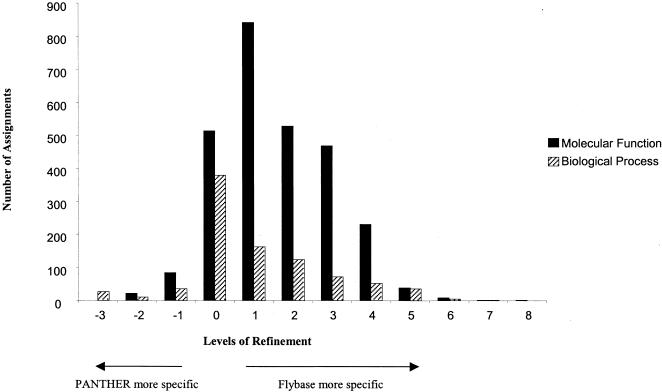
The functional classification of genes on a genome-wide scale is now in its infancy, and we make a first attempt to assess existing methods and identify sources of error. To this end, we compared two independent efforts for associating proteins with functions, one implemented by FlyBase and the other by PANTHER at Celera Genomics. Both methods make inferences based on sequence similarity and the available experimental evidence. However, they differ considerably in methodology and process. Overall, assuming that the systematic error across the two methods is relatively small, we find the protein-to-function association error rate of both the FlyBase and PANTHER methods to be <2%. The primary source of error for both methods appears to be simple human error. Although homology-based inference can certainly cause errors in annotation, our analysis indicates that the frequency of such errors is relatively small compared with the number of correct inferences. Moreover, these homology errors can be minimized by careful tree-based inference, such as that implemented in PANTHER. Often, functional associations are made by one method and not the other, indicating that one of the greatest challenges lies in improving the completeness of available ontology associations.


Figures

Figure 1
Figure 1
Process for comparing FlyBase–GO and PANTHER–GO associations for Drosophila proteins.
Figure 2
Figure 2
Coverage of Drosophila proteins classified by FlyBase and PANTHER. (AC) Classification coverage for molecular function categories. (A) FlyBase associated 6301 proteins (red area) with at least one GO molecular function. (B) PANTHER associated 4862 proteins (blue area) with a GO molecular function. The light gray area indicates proteins that hit a PANTHER HMM, but were not associated with a GO term (see text for details), whereas the dark gray area indicates proteins that did not hit any PANTHER HMMs. (C) Venn diagram illustrating the overlap between proteins classified by FlyBase and PANTHER. (DF) Classification coverage for biological process categories. (D) number of proteins classified by FlyBase, (E) number classified by PANTHER, and (F) the overlap between sets of proteins classified by the two methods.
Figure 3
Figure 3
Assessment of molecular function associations of proteins that were classified by both FlyBase and PANTHER. This subset of proteins corresponds to the purple area in Figure 2C. The majority of the molecular function association matches between FlyBase and PANTHER were determined by an automated process (blue slices). The remaining unmatched associations were manually reviewed, and classified as either matched (gray blue), correct (purple), incorrect (red), or inconclusive (yellow).
Figure 4
Figure 4
Function inference in the context of a protein sequence tree. This is the PANTHER tree-attribute view, with a sequence-derived tree in the left panel, and a table of sequence (or subfamily) attributes in the right panel. The top figure shows the tree “collapsed” into curator-defined subfamilies. Note that the transporter subfamily (SF7, in green) has been separated by the curator from neighboring groups of proteins that are α-glucosidase-related (SF10 in red, and SF11 in pink). The bottom figure shows the “expanded” view with information about each sequence taken from GenBank and SWISS-PROT.
Figure 5
Figure 5
Method for automated comparison of PANTHER and FlyBase assignments. The PANTHER/X ontology was designed as a more lightweight version of GO, and therefore the PANTHER–GO associations will not generally have the same degree of specificity as FlyBase–GO associations. To compare the FlyBase and PANTHER associations directly, it was often necessary to trace up the GO classification to match a given FlyBase association to a PANTHER association. For example, PANTHER may associate a protein with the term tyrosine kinase receptor (yellow), which corresponds to the GO category transmembrane receptor protein tyrosine kinase (GO:0004714; yellow area designates the term and its children). If this same protein is associated by FlyBase with one or more of the GO categories in yellow, we consider PANTHER and FlyBase assignments as a “match.” However, if the protein is associated by FlyBase with transmembrane receptor protein serine/threonine kinase (blue area, a sibling but not a child), we consider the PANTHER and FlyBase associations as “unmatched.”
Figure 6
Figure 6
Specificity comparison between matched FlyBase–GO and PANTHER–GO associations. “Levels of refinement” is the number of levels in the GO schema that separate the FlyBase–GO association from the matched PANTHER–GO association. Positive numbers indicate that the FlyBase association was more specific than the matched PANTHER association, whereas negative numbers indicate that the FlyBase association was less specific. In general, the PANTHER–GO associations are less specific because only the PANTHER/X abbreviated ontology was mapped to GO, and not the more specific PANTHER/LIB.

References

    1. Adams, M.D., Celniker, S.E., Holt, R.A., Evans, C.A., Gocayne, J.D., Amanatides, P.G., Scherer, S.E., Li, P.W., Hoskins, R.A., Galle, R.F., et al. 2000. The genome sequence of Drosophila melanogaster. Science 287: 2185–2195. - PubMed
    1. Aparicio, S., Chapman, J., Stupka, E., Putnam, N., Chia, J.M., Dehal, P., Christoffels, A., Rash, S., Hoon, S., Smit, A., et al. 2002. Whole-genome shotgun assembly and analysis of the genome of Fugu rubripes. Science 297: 1301–1310. - PubMed
    1. Arabidopsis Genome Initiative. 2000. Analysis of the genome sequence of the flowering plant Arabidopsis thaliana. Nature 408: 796–815. - PubMed
    1. Ashburner, M., Ball, C.A., Blake, J.A., Botstein, D., Butler, H., Cherry, J.M., Davis, A.P., Dolinski, K., Dwight, S.S., Eppig, J.T., et al. The Gene Ontology Consortium. 2000. Gene ontology: Tool for the unification of biology. Nat. Genet. 25: 25–29. - PMC - PubMed
    1. Bairoch, A. and Apweiler, R. 2000. The SWISS-PROT protein sequence database and its supplement TrEMBL in 2000. Nucleic Acids Res. 28: 45–48. - PMC - PubMed

WEB SITE REFERENCES

    1. http://panther.celera.com; PANTHER Classification System.
    1. http://www.ensembl.org/Caenorhabditis_briggsae/; Ensembl C. briggsae Genome Server.
    1. http://www.flybase.org; FlyBase@flybase.bio.indiana.edu; FlyBase.
    1. http://www.fruitfly.org/sequence/sequence_db/aa_gadfly.dros.RELEASE2; FlyBase Release 2.
    1. http://www.geneontology.org/; Gene Ontology Consortium.

Publication types

LinkOut - more resources