. 2003 Sep;112(5):670-82.
doi: 10.1172/JCI17991.

Bacillus anthracis lethal toxin induces TNF-alpha-independent hypoxia-mediated toxicity in mice

Affiliations

Bacillus anthracis lethal toxin induces TNF-alpha-independent hypoxia-mediated toxicity in mice

Mahtab Moayeri et al. J Clin Invest. 2003 Sep.

Abstract

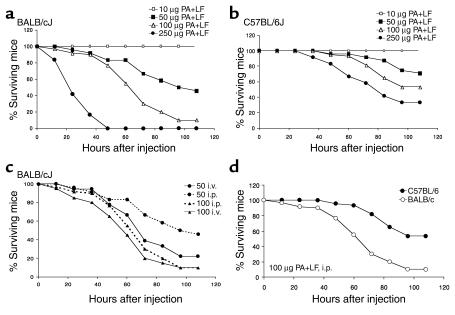
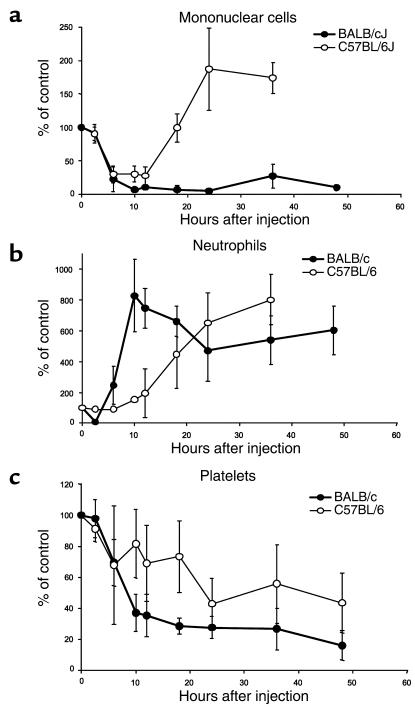
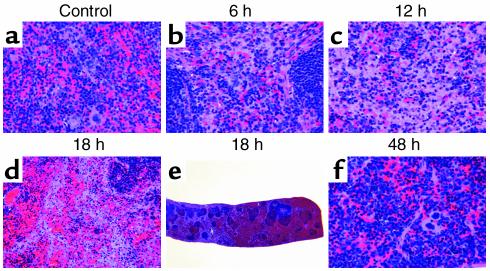
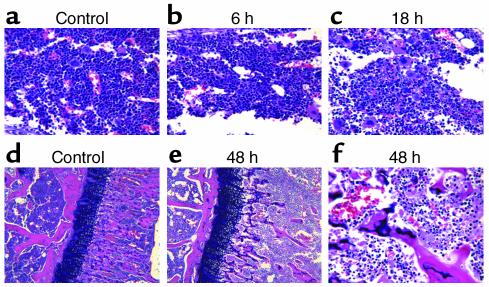
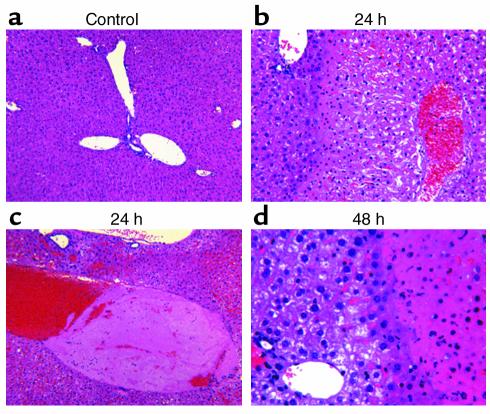
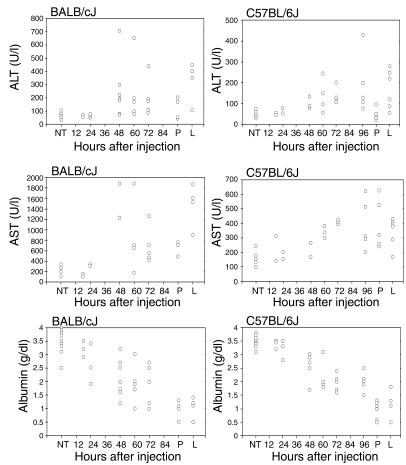
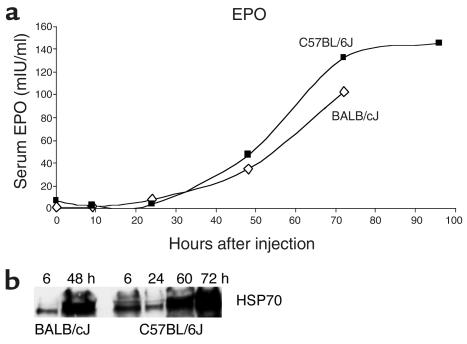
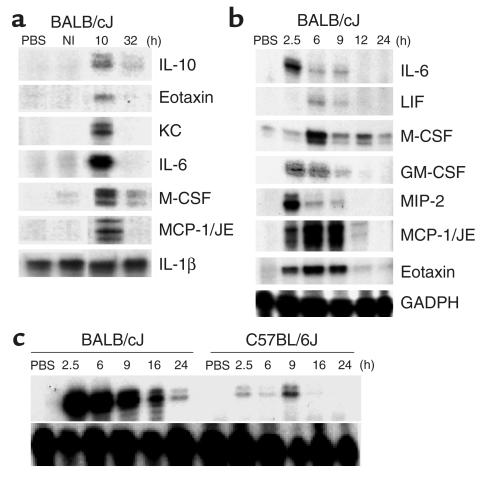
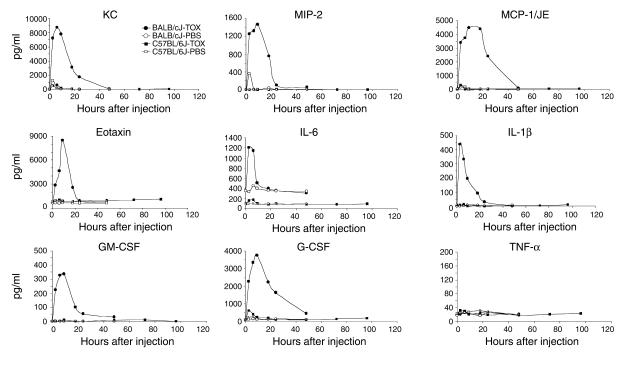
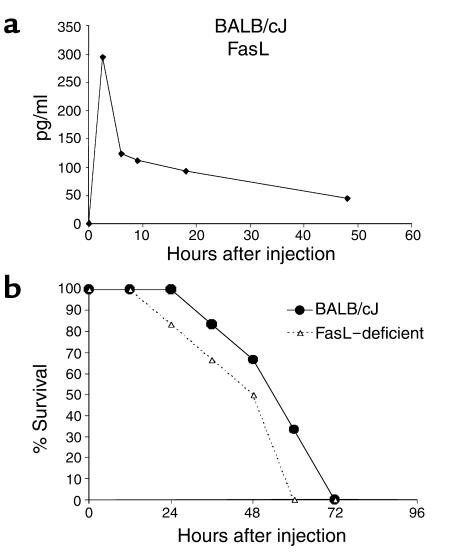
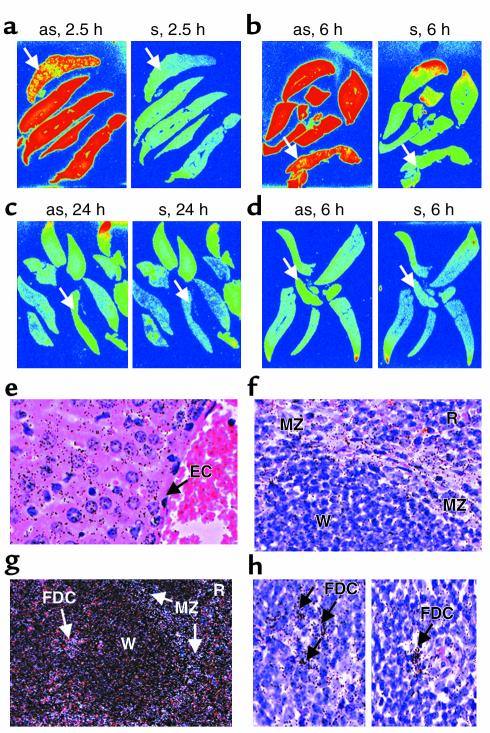
Bacillus anthracis lethal toxin (LT) is the major virulence factor of anthrax and reproduces most of the laboratory manifestations of the disease in animals. We studied LT toxicity in BALB/cJ and C57BL/6J mice. BALB/cJ mice became terminally ill earlier and with higher frequency than C57BL/6J mice. Timed histopathological analysis identified bone marrow, spleen, and liver as major affected organs in both mouse strains. LT induced extensive hypoxia. Crisis was due to extensive liver necrosis accompanied by pleural edema. There was no evidence of disseminated intravascular coagulation or renal dysfunction. Instead, analyses revealed hepatic dysfunction, hypoalbuminemia, and vascular/oxygenation insufficiency. Of 50 cytokines analyzed, BALB/cJ mice showed rapid but transitory increases in specific factors including KC, MCP-1/JE, IL-6, MIP-2, G-CSF, GM-CSF, eotaxin, FasL, and IL-1beta. No changes in TNF-alpha occurred. The C57BL/6J mice did not mount a similar cytokine response. These factors were not induced in vitro by LT treatment of toxin-sensitive macrophages. The evidence presented shows that LT kills mice through a TNF-alpha-independent, FasL-independent, noninflammatory mechanism that involves hypoxic tissue injury but does not require macrophage sensitivity to toxin.


Figures

Figure 1
Figure 1
LT toxicity in inbred mice. (a and b) Comparison of four doses of PA plus LF in BALB/cJ (a) and C57BL/6J (b) mice. Mice were injected i.p. with 1 ml of toxin in PBS. Results are based on n = 12, n = 24, n = 60, and n = 12 for 10 μg, 50 μg, 100 μg, and 250 μg of each toxin component. (c) Comparison of i.p. and i.v. routes of injection in the BALB/cJ mouse. Results are based on n = 18, n = 24, n = 60, and n = 20 for 50 μg i.v., 50 μg i.p., 100 μg i.p., and 100 μg i.v. of each toxin component. The differences in i.p. and i.v. survival curves at both 50 and 100 μg are not statistically significant by the log-rank test (P = 0.0807 and 0.553, respectively). The difference between the 50-μg i.p. curve and both 100-μg curves is statistically significant (P = 0.0013 and P = 0.0002). (d) Data from a and b for the 100-μg dose injected i.p., presented to allow direct comparison of the single selected dose used in all further experiments.
Figure 2
Figure 2
LT effects on circulating monocytes, neutrophils, and platelets. Graphs show circulating monocyte (a), neutrophil (b), and platelet (c) levels in response to LT treatment as a percentage of untreated controls. Values are the mean of the percentage change in two to eight individual pooled experiments using both i.p. and i.v. treated mice at doses of 50 μg, 100 μg, and 250 μg LT, based on groups of two to four mice per time point. Values were calculated as the percentage change in cell number relative to a PBS-treated control group (two to four mice per experiment). Absolute control cell numbers differed in each experiment. Error bars indicate SD for the mean percentage change. Unpaired t test analysis indicates that differences in curves in a are statistically significant at 18, 24, and 36 hours (P = 0.008, P < 0.0001, and P < 0.0001, respectively). In b, differences in the two strains are only significant at 10 and 12 hours (P = 0.002 and P = 0.004, respectively). In c, differences in the two strains are not significant at any point. In a, differences relative to 0 hours are statistically significant at all times past 6 hours in BALB/cJ and at 6, 10, 12, and 36 hours in C57BL/6J. In b and c, differences relative to 0 hours are statistically significant beyond 10 hours in BALB/cJ and beyond 24 hours in C57BL/6J.
Figure 3
Figure 3
Histopathological analysis of LT-treated BALB/cJ mouse spleen. (a) Red pulp from PA-injected (48 hours) control. 40× objective. (b) Individual cell death in red pulp with relative sparing of white pulp at 6 hours after LT treatment. 40× objective. (c) Advanced necrosis in red pulp at 12 hours. 40× objective. (d) Hemorrhage in red and white pulp at 18 hours. 20× objective. (e) Hemorrhage in red and white pulp at 18 hours. 2× objective. (f) Resolution of cell death with restoration of extramedullary hematopoiesis (EMH) at 48 hours. 40× objective. Dosage was 100 μg PA (control) or 100 μg LT.
Figure 4
Figure 4
Histopathological analysis of LT-treated BALB/cJ bone marrow. (a) Diaphyseal marrow from PA-treated (48 hours) control. 40× objective. (b) A mild degree of individual cell death in diaphyseal marrow at 6 hours after LT treatment. 40× objective. (c) A moderate degree of individual cell death in diaphyseal marrow at 18 hours. 40× objective. (d) Metaphyseal (right) and epiphyseal (left) marrow in PA-treated (48 hours) control. 10× objective. (e) Necrosis of metaphyseal marrow (right) with sparing of epiphyseal marrow (left) at 48 hours after LT treatment. 10× objective. (f) Necrosis of metaphyseal bone marrow at 48 hours. 40× objective. Dosage was 100 μg PA (control) or 100 μg LT.
Figure 5
Figure 5
Histopathological analysis of LT-treated BALB/cJ liver. (a) Liver from PA-injected (48 hours) control. 10× objective. (b) Centrilobular coagulative necrosis (right) with normal liver and sparing of portal region (upper left) at 24 hours after LT treatment. 20× objective. (c) Poorly formed thrombus at 24 hours. 10× objective. (d) Advanced liver necrosis (right) with continued sparing of portal region (lower left) at 48 hours. 40× objective. Dosage was 100 μg PA (control) or 100 μg LT.
Figure 6
Figure 6
Serum ALT (a and b), AST (c and d), and albumin (e and f) levels in LT-treated mice. ALT, AST, and albumin were analyzed from serum at 18, 24, 48, 60, 72 (BALB/cJ and C57BL/6J), and 96 hours (C57BL/6J), as well as from premortem mouse peritoneal (P) and lung (L) fluids of both strains. Intraperitoneal dosage was 100 μg LT. Each data point represents one mouse. The number of sera analyzed at each time point ranged from three to eight.
Figure 7
Figure 7
LT-induced hypoxia. (a) Mice were injected i.p. with 1.0 ml of PBS or 100 μg LT. Serum EPO measurements at each time point represent averages of values assessed for two samples, with each sample representing sera pooled from three mice. The exception is the 72-hour time point for BALB/cJ, which represents measurement of one sample composed of pooled sera from three mice. (b) Liver extracts from BALB/cJ or C57BL/6J mice treated i.p. with 100 μg LT for 6, 24, 60, and 72 hours were analyzed for HSP70 levels by Western blot.
Figure 8
Figure 8
RPA analysis of LT-treated mice. (a) BALB/cJ mice were treated i.p. with 100 μg LT, and spleens were obtained after 10 or 32 hours. PBS-injected and noninjected (NI) controls were included for comparison. (b) A similar experiment with additional time points. A PBS-injected control was included for comparison. (c) Comparison of BALB/cJ and C57BL/6J spleen KC RNA levels at various times after i.p. injection of 100 μg LT. GADPH was used as a control for equal RNA loading in all lanes.
Figure 9
Figure 9
Time course of serum cytokine protein levels after LT treatment. Mice were injected i.p. with 1.0 ml of PBS or LT (TOX; 100 μg PA + 100 μg LF). ELISA determinations were done on sera pooled from three to five mice for each time point and treatment.
Figure 10
Figure 10
LT induction of FasL and cytotoxicity in FasL-deficient mice. (a) BALB/cJ mice were treated i.p. with 100 μg LT, and ELISA determinations were done on sera pooled from three mice for each time point. (b) BALB/cJ (n = 6) or FasL-deficient (n = 6) mice were injected i.p. with 100 μg LT, and time to death was recorded for each strain.
Figure 11
Figure 11
Induction of KC in spleen and liver analyzed by in situ hybridization. BALB/cJ or C57BL/6J mice were injected i.p. with 100 μg LT. Spleens and livers were harvested at 2.5, 6, 24, or 36 hours after injection for in situ analysis of KC production. (ac) Whole-organ-section phosphorimages of sense (s; control) and antisense (as) 35S KC probe hybridization to BALB/cJ spleen and liver at 2.5 hours (a), 6 hours (b), and 24 hours (c). (d) Sections of C57BL/6J mouse organs at 6 hours after LT. Arrows in ad indicate the single spleen section in each panel; all other sections are liver. Red signifies the highest intensity of signal, while bluish-green is negative background. (eh) Silver-grain densities in various regions of each organ. (e) High clustering of grains at liver hepatocytes, with little association with endothelial cells (EC). (f) Higher expression in the spleen marginal zone (MZ) in contrast to white pulp (W). (g) A dark-field image similarly showing the higher silver-grain densities associated with marginal zone (MZ), red pulp (R), and follicular dendritic cells (FDC). (h) High density of silver grains at the FDCs of the white pulp.

Comment in

References

    1. Leppla, S.H. 1999. The bifactorial Bacillus anthracis lethal and oedema toxins. In Comprehensive sourcebook of bacterial protein toxins. J.E. Alouf and J.H. Freer, editors. Academic Press. London, United Kingdom. 243–263.
    1. Beall FA, Dalldorf FG. The pathogenesis of the lethal effect of anthrax toxin in the rat. J. Infect. Dis. 1966;116:377–389. - PubMed
    1. Fish DC, Klein F, Lincoln RE, Walker JS, Dobbs JP. Pathophysiological changes in the rat associated with anthrax toxin. J. Infect. Dis. 1968;118:114–124. - PubMed
    1. Klein F, Hodges DR, Mahlandt BG, Jones WI, Lincoln R. Anthrax toxin: causative agent in the death of Rhesus monkeys. Science. 1962;138:1331–1333. - PubMed
    1. Klein F, et al. Pathophysiology of anthrax. J. Infect. Dis. 1966;116:123–138. - PubMed

Publication types

MeSH terms