. 2003 Sep 1;162(5):781-7.
doi: 10.1083/jcb.200303144.

Local signaling by the EGF receptor

Affiliations

Local signaling by the EGF receptor

Stephan J Kempiak et al. J Cell Biol. .

Abstract

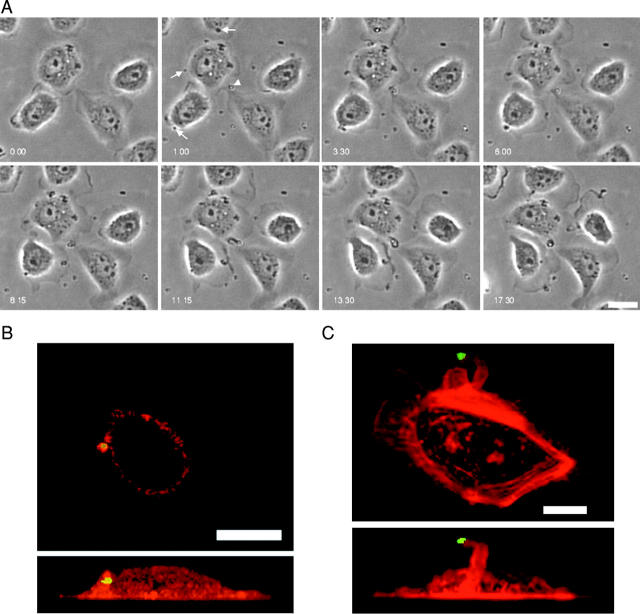
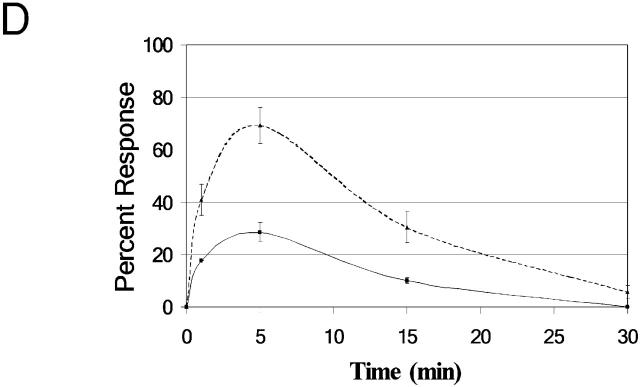
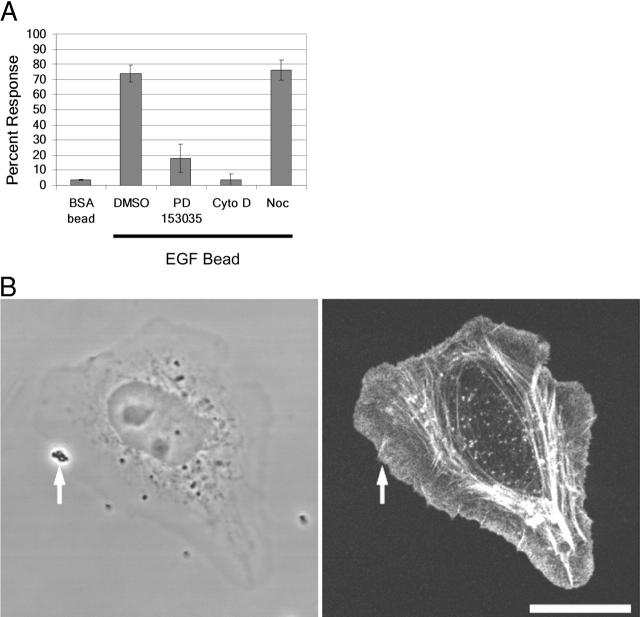
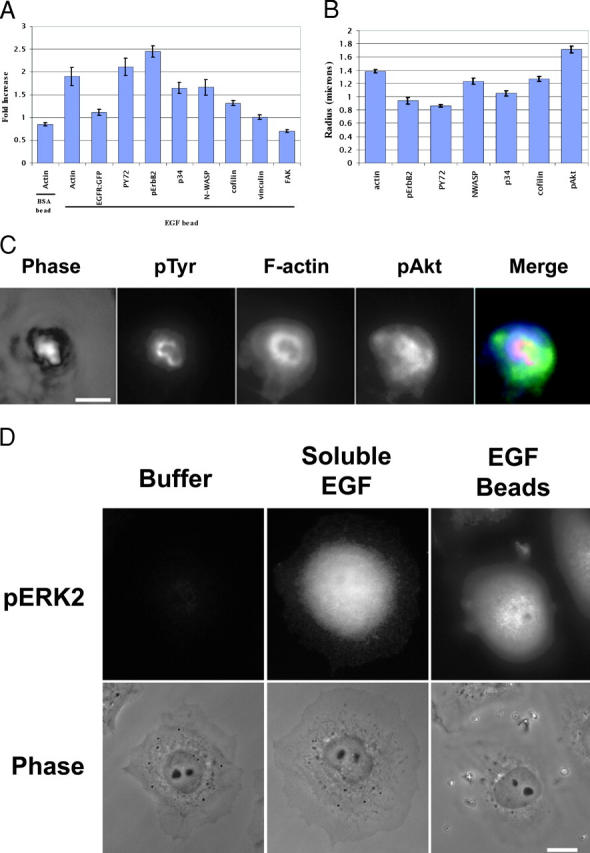
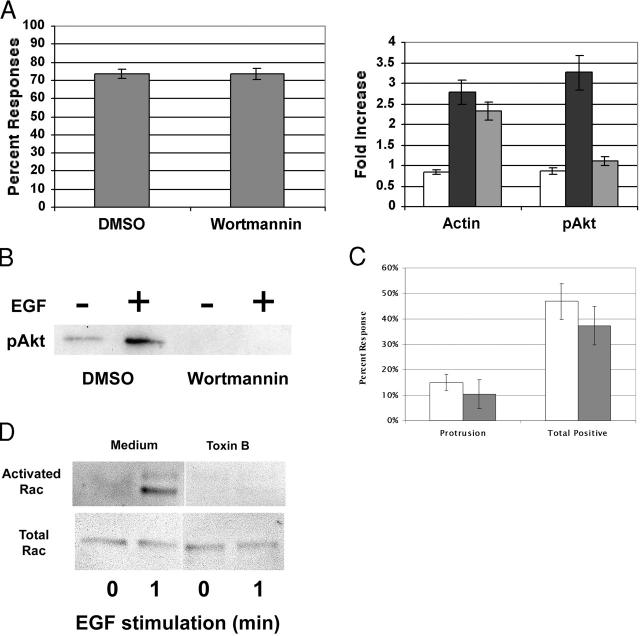
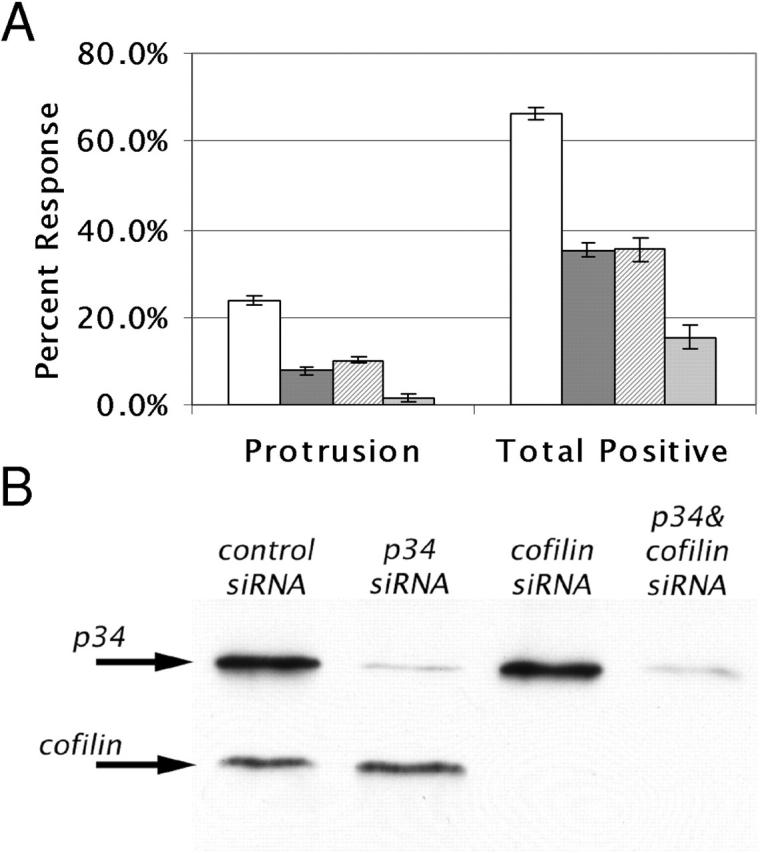
Differing spatial scales of signaling cascades are critical for cell orientation during chemotactic responses. We used biotin EGF bound to streptavidin-coupled magnetic beads to locally stimulate cells overexpressing the EGF receptor. We have found that EGF-induced actin polymerization remains localized even under conditions of receptor overexpression. Conversely, EGF-induced ERK activation spreads throughout the cell body after EGF bead stimulation. The localized actin polymerization is independent of PI3-kinase and rho protein activity and requires Arp2/3 complex and cofilin function. Thus, we find differing spatial scales of signaling from the EGF receptor, supporting models of chemotaxis that integrate short- and long-range signaling.


Figures

Figure 1.
Figure 1.
Responses to EGF-coated beads. (A) MTLn3:EGFR cells were imaged before (first frame, 0.00) and after the addition of EGF beads (1.00 to 17 min 30 s). Arrows indicate beads that induced localized phase densities in subsequent images and the arrowhead indicates a bead that induced a protrusion (Video 1). Bar, 20 μm. (B) Projections from a confocal z series of cells stimulated for 5 min by EGF beads. F-actin is in red and the bead in green. (Top) Confocal slice through the bead region. (Bottom) Side view projection. Bar, 10 μm. (C) Projections from a confocal z series of a protrusion induced by an EGF bead. Bar, 10 μm. See Videos 2 and 3 for rotations of B and C. (D) Kinetics of actin polymerization. The dashed curve represents all positive responses as indicated by increased rhodamine phalloidin staining (including protrusions). The solid curve represents protrusions only. Data represent the mean ± SEM of three experiments; n = 50 for each experiment. All videos are available at http://www.jcb.org/cgi/content/full/jcb.200303144/DC1.
Figure 1.
Figure 1.
Responses to EGF-coated beads. (A) MTLn3:EGFR cells were imaged before (first frame, 0.00) and after the addition of EGF beads (1.00 to 17 min 30 s). Arrows indicate beads that induced localized phase densities in subsequent images and the arrowhead indicates a bead that induced a protrusion (Video 1). Bar, 20 μm. (B) Projections from a confocal z series of cells stimulated for 5 min by EGF beads. F-actin is in red and the bead in green. (Top) Confocal slice through the bead region. (Bottom) Side view projection. Bar, 10 μm. (C) Projections from a confocal z series of a protrusion induced by an EGF bead. Bar, 10 μm. See Videos 2 and 3 for rotations of B and C. (D) Kinetics of actin polymerization. The dashed curve represents all positive responses as indicated by increased rhodamine phalloidin staining (including protrusions). The solid curve represents protrusions only. Data represent the mean ± SEM of three experiments; n = 50 for each experiment. All videos are available at http://www.jcb.org/cgi/content/full/jcb.200303144/DC1.
Figure 2.
Figure 2.
Bead responses depend on actin polymerization and EGFR kinase. (A) MTLn3:EGFR cells were treated with 0.1% DMSO, 1 μM cytochalasin D, or 1 μM nocodazole for 1 min, or 1 μM PD153035 for 15 min. BSA beads or EGF beads were then added to the cells for 5 min followed by fixation and staining with rhodamine phalloidin. Total positive responses are reported. Data represent the mean ± SEM of three experiments; n = 50 for each experiment. (B) EGF beads were added simultaneously with 5 nM EGF for three min. The cells were stained and fixed for F-actin. Arrow indicates location of bead in fluorescence image. Bar, 20 μm.
Figure 3.
Figure 3.
Localization of signaling proteins around EGF beads. (A) The relative increase in signal for the indicated molecule near the bead (5 min after application), relative to plasma membranes far from the bead in the same plane of focus, is given. Data are mean ± SEM from >33 cells in two or more separate experiments. (B) The areas of increased intensity of the samples measured in A were determined, and a radius calculated, assuming a circular shape. Means and SEM from >33 cells in two or more experiments are shown. (C) Comparison of phase, phosphotyrosine (pTyr, red), F-actin (blue), and phosphoAkt (pAkt, green) distributions in one cell stimulated with an EGF bead. Bar, 2 μm. (D) Global ERK activation. Cells were stimulated with buffer (left), 10 nM soluble EGF (middle), or EGF beads (right) for 5 min and then fixed and stained for phosphoERK (fluorescence on top, phase images on bottom). Beads are phase bright in the right hand phase image. Bar, 10 μm.
Figure 4.
Figure 4.
The EGF bead response is PI3-kinase and rho family GTPase independent. (A) MTLn3:EGFR cells were starved for 1 h, and then treated with DMSO or 100 nM Wortmannin for 15 min. Cells recovered for 1 h, before being treated with either EGF beads for 5 min (A) or 10 nM soluble EGF (B) for 3 min. (A, left) The percentage of cells responding to beads treated with Wortmannin or DMSO. Data represent the mean ± SEM from >120 cells in three separate experiments. (A, right) Wortmannin effects on actin polymerization and phosphoAkt near beads. BSA beads (white), or EGF beads (black and gray), were given to cells that were pretreated with DMSO (white, black) or 100 nM Wortmannin (gray). The relative increase in staining for F-actin and pAkt near the beads compared with plasma membranes far from the beads was measured. Data represent the mean ± SEM from >60 cells in two or more separate experiments. (B) Cells untreated or treated with 10 nM soluble EGF and Wortmannin were lysed, and the whole cell lysates were probed for pAkt. (C) MTLn3:EGFR cells were starved for 1 h, and then treated with DMSO (white) or 50 ng/ml Toxin B (gray) for 1 h. The cells were then stimulated for 80 s, and the response was then analyzed. Data represent the mean ± SEM from >120 cells in four or more separate experiments. (D) Cells untreated or treated for 1 min with 5 nM soluble EGF and Toxin B were lysed and probed for activated rac by GST-CRIB pulldown (top) or total rac content (bottom) as described in Materials and methods.
Figure 5.
Figure 5.
The Arp2/3 complex and cofilin work synergistically to create the EGF bead response. (A) MTLn3:EGFR cells transfected with control (white), p34 (dark gray), cofilin (stripes), or both p34 and cofilin siRNA (light gray) for 4 h. Cells were then cultured for 24–48 h before being analyzed. Cells were stimulated with EGF-coated beads for 80 s, fixed, and stained for rhodamine phalloidin, and the cell response was analyzed. Data represent the mean ± SEM from >180 cells in three separate experiments. (B) Lysates from cells treated with siRNA as in A were blotted for cofilin and p34 protein expression levels.

Similar articles

Cited by

References

    1. Bailly, M., I. Ichetovkin, W. Grant, N. Zebda, L.M. Machesky, J.E. Segall, and J. Condeelis. 2001. The F-actin side binding activity of the Arp2/3 complex is essential for actin nucleation and lamellipod extension. Curr. Biol. 11:620–625. - PubMed
    1. Bailly, M., J. Wyckoff, B. Bouzahzah, R. Hammerman, V. Sylvestre, M. Cammer, R. Pestell, and J.E. Segall. 2000. Epidermal growth factor receptor distribution during chemotactic responses. Mol. Biol. Cell. 11:3873–3883. - PMC - PubMed
    1. Brock, R., and T.M. Jovin. 2001. Heterogeneity of signal transduction at the subcellular level: microsphere-based focal EGF receptor activation and stimulation of Shc translocation. J. Cell Sci. 114:2437–2447. - PubMed
    1. Chan, A.Y., M. Bailly, N. Zebda, J.E. Segall, and J.S. Condeelis. 2000. Role of cofilin in epidermal growth factor-stimulated actin polymerization and lamellipod protrusion. J. Cell Biol. 148:531–542. - PMC - PubMed
    1. Condeelis, J.S., J.B. Wyckoff, M. Bailly, R. Pestell, D. Lawrence, J. Backer, and J.E. Segall. 2001. Lamellipodia in invasion. Semin. Cancer Biol. 11:119–128. - PubMed

Publication types

MeSH terms