. 2003 Sep 1;162(5):809-20.
doi: 10.1083/jcb.200304096.

Inheritance of gene density-related higher order chromatin arrangements in normal and tumor cell nuclei

Affiliations

Inheritance of gene density-related higher order chromatin arrangements in normal and tumor cell nuclei

Marion Cremer et al. J Cell Biol. .

Abstract

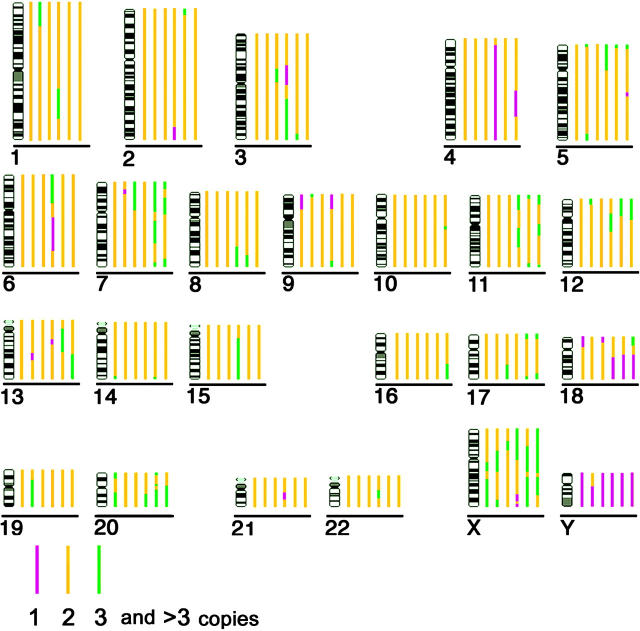
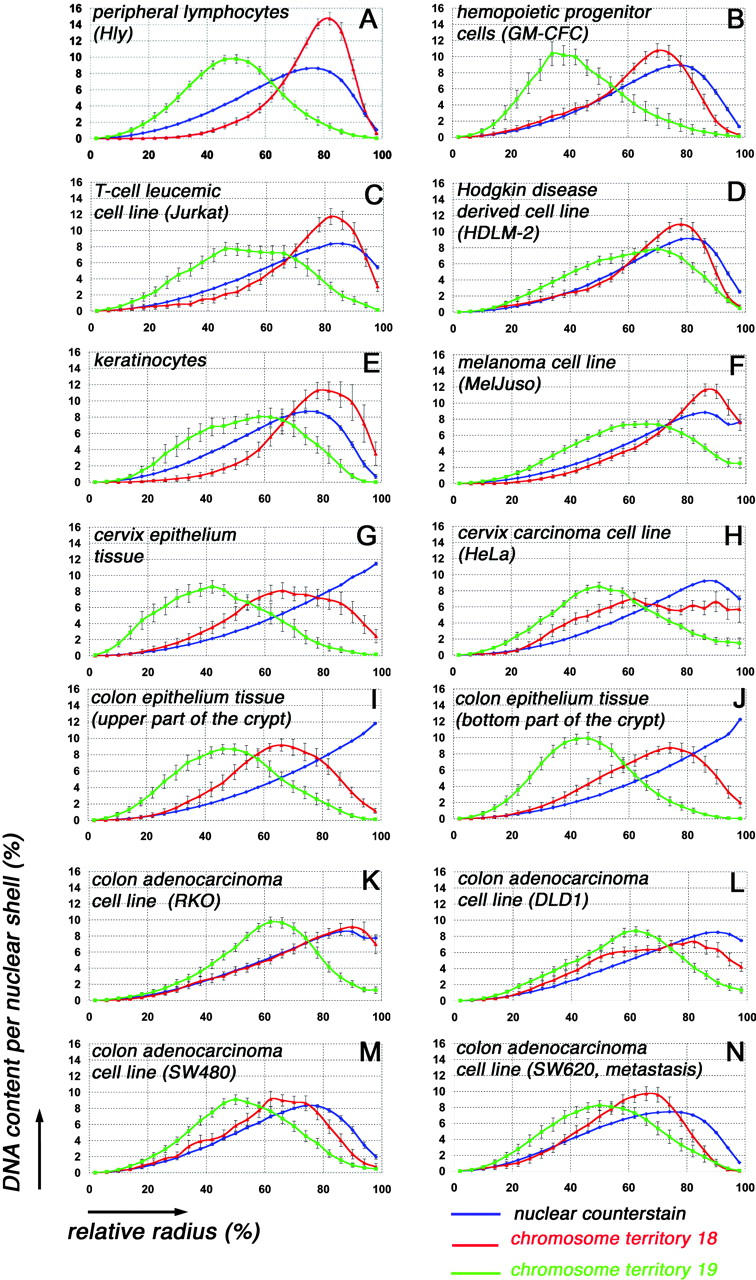
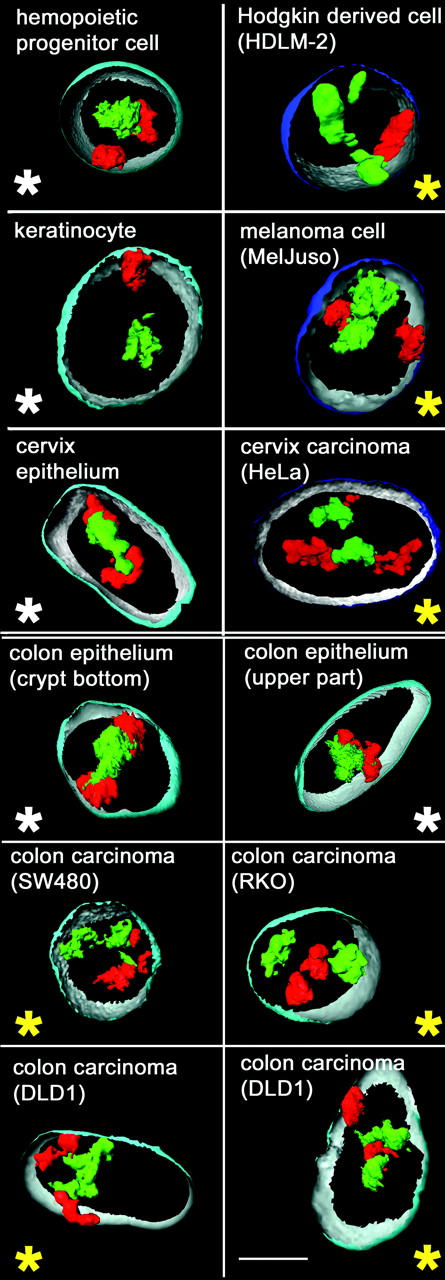
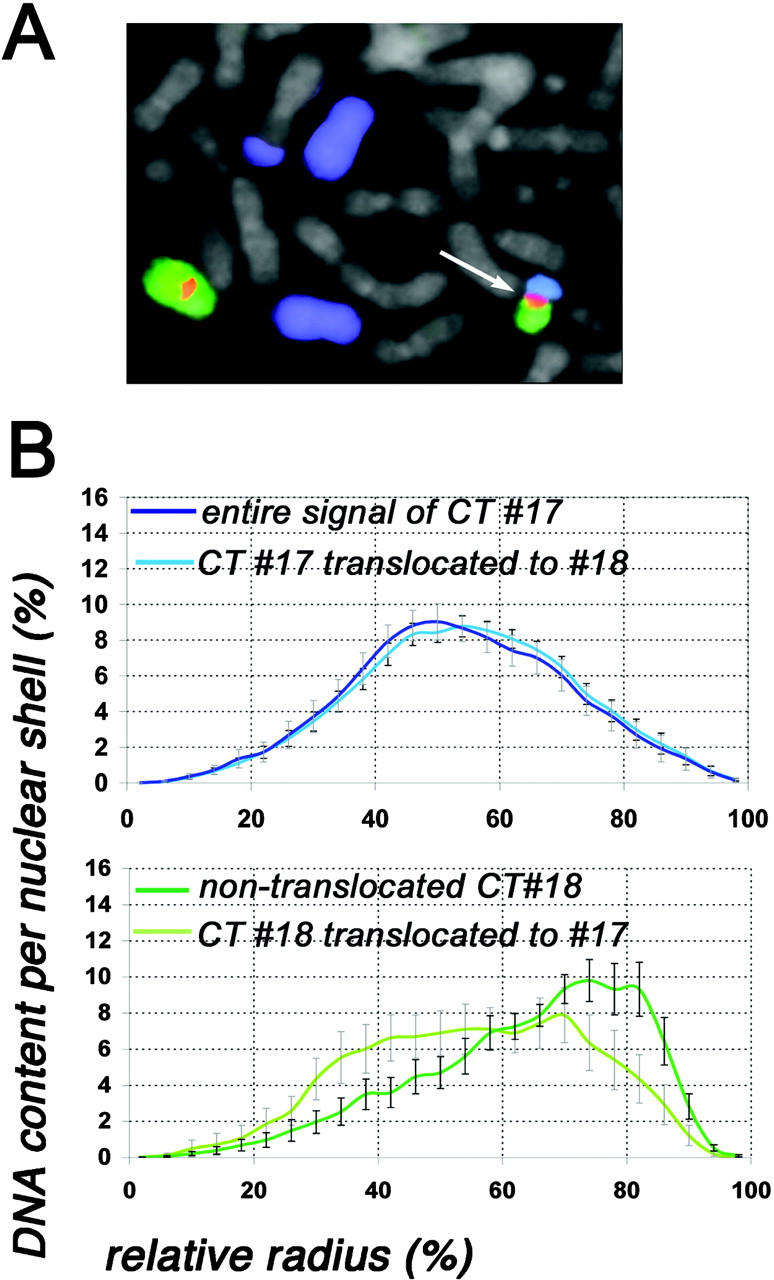
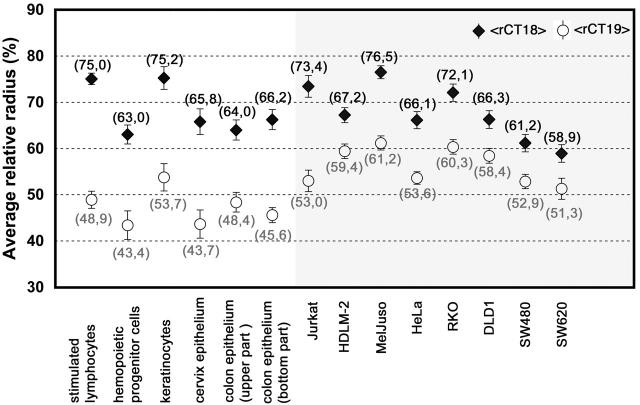
A gene density-related difference in the radial arrangement of chromosome territories (CTs) was previously described for human lymphocyte nuclei with gene-poor CT #18 located toward the nuclear periphery and gene-dense CT #19 in the nuclear interior (Croft, J.A., J.M. Bridger, S. Boyle, P. Perry, P. Teague, and W.A. Bickmore. 1999. J. Cell Biol. 145:1119-1131). Here, we analyzed the radial distribution of chromosome 18 and 19 chromatin in six normal cell types and in eight tumor cell lines, some of them with imbalances and rearrangements of the two chromosomes. Our findings demonstrate that a significant difference in the radial distribution of #18 and #19 chromatin is a common feature of higher order chromatin architecture in both normal and malignant cell types. However, in seven of eight tumor cell lines, the difference was less pronounced compared with normal cell nuclei due to a higher fraction of nuclei showing an inverted CT position, i.e., a CT #18 located more internally than a CT #19. This observation emphasizes a partial loss of radial chromatin order in tumor cell nuclei.


Figures

Figure 1.
Figure 1.
Copy numbers of chromosome segments estimated by CGH analysis, considering ploidy information of the karyotypes from each cell line. Each bar represents the chromosome copy number in a particular cell line; different copy numbers are represented by different colors according to the key shown. Cell lines from left (nearest to chromosome ideogram) to right are: (1) Jurkat; (2) HDLM-2; (3) MelJuso; (4) HeLa; (5) SW480; (6) SW620 (furthest from chromosome ideogram). Note that the HeLa cell line is near triploid. Accordingly, the loss of material (i.e., chromosomes 4 and 18q) indicates a disomic status (compare with Table I).
Figure 2.
Figure 2.
Quantitative 3D evaluation in the different cell types of radial CT #18 and CT #19 distribution in 25 concentric nuclear shells after painting with DNA probes specific for chromosome 18 (red) and chromosome 19 (green). Blue curves represent counterstained DNA. The abscissa denotes the relative radius r of the nuclear shells, the ordinate the normalized sum of intensities in the voxels for a respective fluorochrome assigned to a given shell. For normalization, the area underlying the curve for each color (total relative DNA content) was set to 100. Note the different curve for the DNA counterstain obtained in nuclei of cultivated cells (A–F, H, and K–N) and in nuclei obtained from tissue sections (G, I, and J). For explanation, see Materials and methods. All graphs show the different radial positioning of CT # 18 and CT #19 material. Bars indicate SEM.
Figure 3.
Figure 3.
Visualization of CTs #18 (red) and CTs #19 (green) in 3D reconstructions of selected cell types. Part of the nuclear border is indicated by reconstruction of the counterstain periphery (outside, blue; inside, silver-gray). Note that in nuclei of normal cells (panels marked by a white asterisk), the CTs #19 are closely attached in the nuclear interior, whereas CTs #18 are found at the nuclear periphery, either side-by-side or at remote sites. In tumor cell nuclei (panels marked by a yellow asterisk), this radial distribution difference is often less apparent; note, for example, a peripheral CT #19 in a Hodgkin-derived cell nucleus (top right) or the internal position of a CT #18, which is located between two CTs #19 in one of the two DLD1 nuclei (bottom right panel) displayed. Bar, 5 μm.
Figure 4.
Figure 4.
Evaluation of CT #17 and CT #18 distribution of the SW620 cell line carrying a translocation t(17;18). (A) Part of a metaphase spread after painting of chromosome 17 (visualized in blue) and chromosome 18 (visualized in green). The chromosome 18 centromere is visualized in red. In the metaphase shown, chromosome 17 is present as two free, normal copies and as two different translocation chromosomes, one of them forming the der(18)t(17;18) (arrow). The centromere of this rearranged chromosome is chromosome 18 specific. Chromosome 18 is also present as one normal copy. (B) Quantitative 3D evaluation of the radial CT #17 and CT #18 distribution in 22 nuclei. The abscissa denotes the relative radius r of the nuclear shells, the ordinate the normalized sum of intensities in the voxels for a respective fluorochrome assigned to a given shell. In the top panel, the dark blue curve denotes the radial distribution of the entire chromosome 17 material after painting with a DNA probe specific for chromosome 17, and the light blue curve denotes only chromosome 17 material translocated to chromosome 18. Note the almost identical curves for both fractions of CT #17 material. In the bottom panel, the dark green curve denotes the radial distribution of free CTs #18, and the light green curve denotes chromosome 18 material translocated to chromosome 17. Note the distinctly more peripheral positioning of the nontranslocated fraction of CTs #18 in comparison to the translocated fraction. Bars indicate SEM.
Figure 5.
Figure 5.
Comparison of the average relative radii of the intensity-weighted fluorescence, represented by CT #18 (black rhombi) and CT #19 (white circles) material of all cell types analyzed. The left panel (white background) displays the data of normal cells, the right panel (gray background) the data of tumor cells. In all cell types, the average relative radius for CT #18 (<rCT18>) is larger compared with CT #19 (<rCT19>). The distances between <rCT18> and <rCT19> are smaller in the majority of tumor cell lines in comparison to normal cell nuclei (compare with Table III). Numbers in parentheses indicate the exact value of the average relative radii.

References

    1. Abdel-Rahman, W.M., K. Katsura, W. Rens, P.A. Gorman, D. Sheer, D. Bicknell, W.F. Bodmer, M.J. Arends, A.H. Wyllie, and P.A. Edwards. 2001. Spectral karyotyping suggests additional subsets of colorectal cancers characterized by pattern of chromosome rearrangement. Proc. Natl. Acad. Sci. USA. 98:2538–2543. - PMC - PubMed
    1. Bach, S.P., A.G. Renehan, and C.S. Potten. 2000. Stem cells: the intestinal stem cell as a paradigm. Carcinogenesis. 21:469–476. - PubMed
    1. Bauer, R.K. 1962. Der median-quartile-test. Metrika. 5:1–16.
    1. Bennett, D.C., K. Bridges, and I.A. McKay. 1985. Clonal separation of mature melanocytes from premelanocytes in a diploid human cell strain: spontaneous and induced pigmentation of premelanocytes. J. Cell Sci. 77:167–183. - PubMed
    1. Boyle, S., S. Gilchrist, J.M. Bridger, N.L. Mahy, J.A. Ellis, and W.A. Bickmore. 2001. The spatial organization of human chromosomes within the nuclei of normal and emerin-mutant cells. Hum. Mol. Genet. 10:211–219. - PubMed

Publication types

MeSH terms