. 2003 Sep 1;162(5):909-18.
doi: 10.1083/jcb.200305145.

Clathrin-mediated endocytosis in AP-2-depleted cells

Affiliations

Clathrin-mediated endocytosis in AP-2-depleted cells

Alison Motley et al. J Cell Biol. .

Abstract

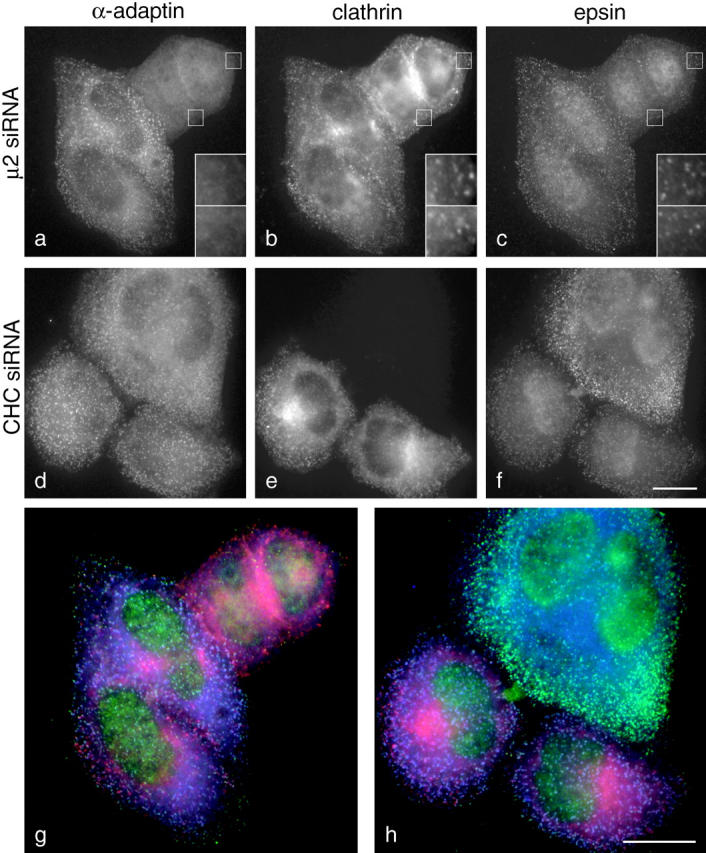
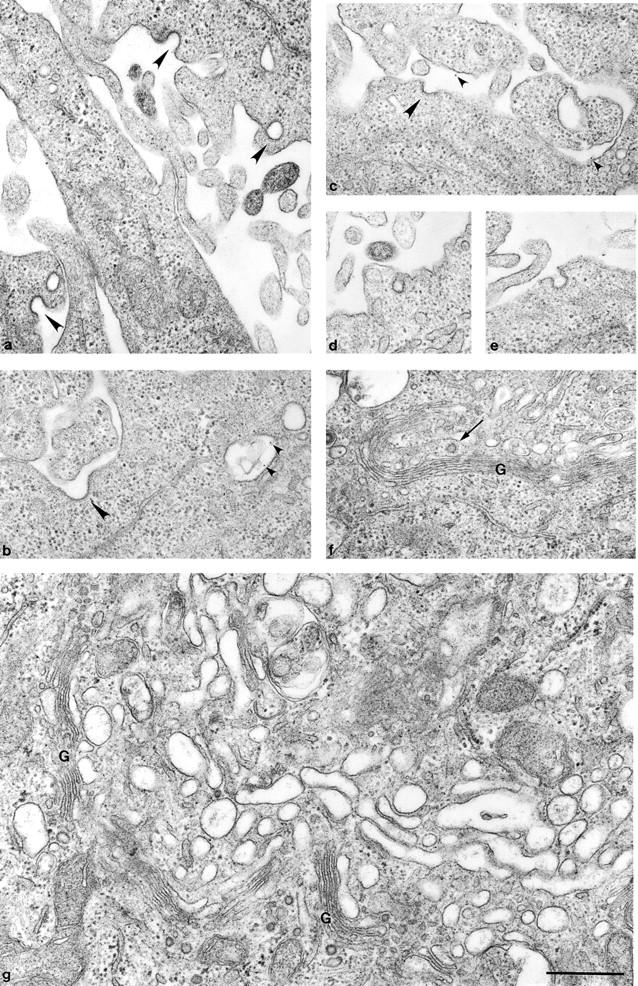
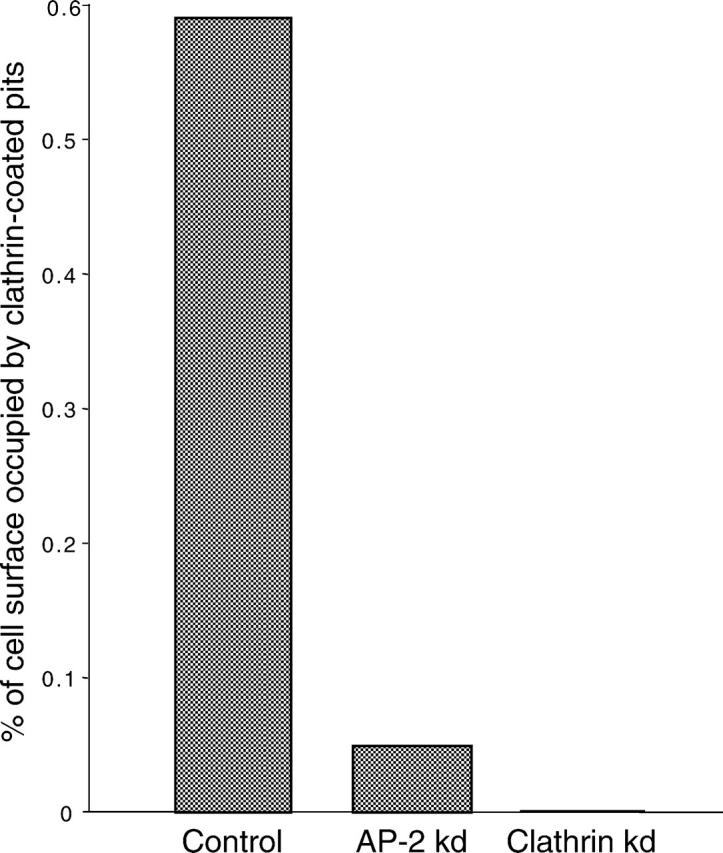
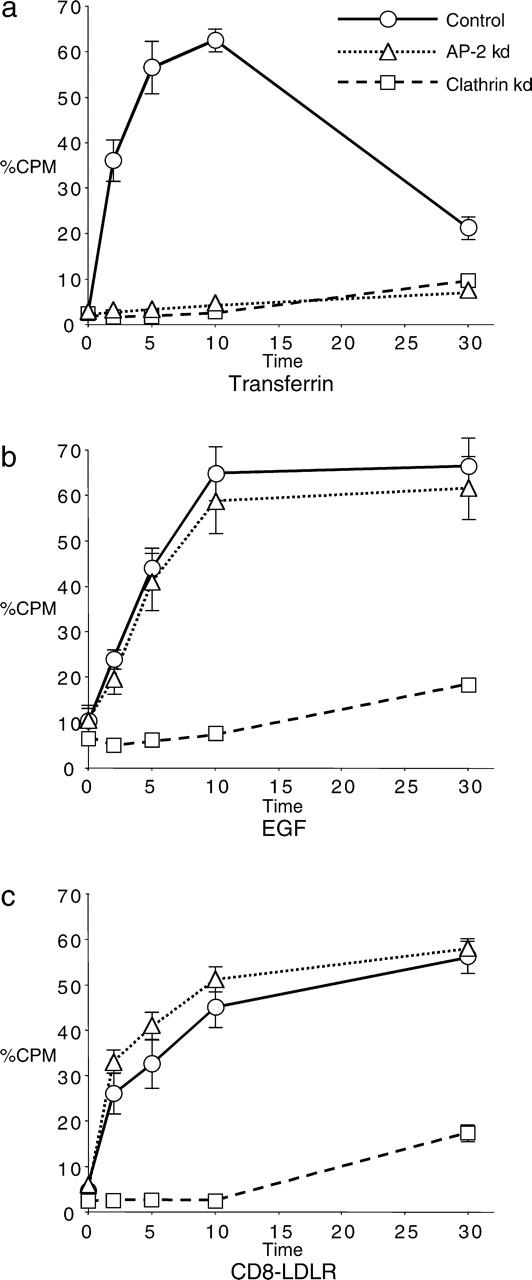
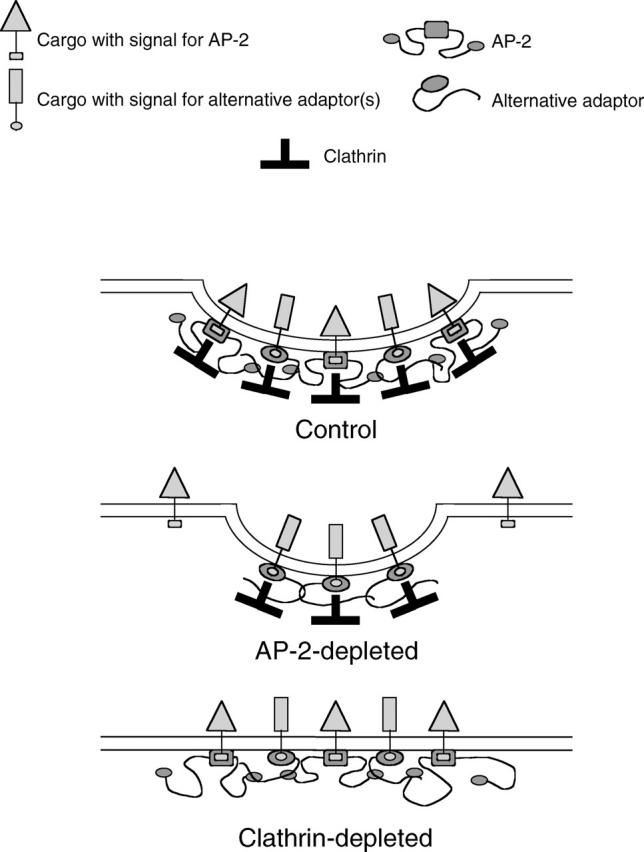
We have used RNA interference to knock down the AP-2 mu2 subunit and clathrin heavy chain to undetectable levels in HeLaM cells. Clathrin-coated pits associated with the plasma membrane were still present in the AP-2-depleted cells, but they were 12-fold less abundant than in control cells. No clathrin-coated pits or vesicles could be detected in the clathrin-depleted cells, and post-Golgi membrane compartments were swollen. Receptor-mediated endocytosis of transferrin was severely inhibited in both clathrin- and AP-2-depleted cells. Endocytosis of EGF, and of an LDL receptor chimera, were also inhibited in the clathrin-depleted cells; however, both were internalized as efficiently in the AP-2-depleted cells as in control cells. These results indicate that AP-2 is not essential for clathrin-coated vesicle formation at the plasma membrane, but that it is one of several endocytic adaptors required for the uptake of certain cargo proteins including the transferrin receptor. Uptake of the EGF and LDL receptors may be facilitated by alternative adaptors.


Figures

Figure 1.
Figure 1.
Effects of depleting AP-2 and clathrin heavy chain from HeLaM cells. (a) Equal protein loadings of homogenates of either control cells or cells treated with siRNAs directed against clathrin heavy chain, α-adaptin, or μ2 were subjected to SDS-PAGE, and Western blots were probed with antibodies against the indicated protein. Clathrin heavy chain and the AP-2 μ2 subunit were both undetectable after knockdown, whereas a weak signal (<5% of control) was detected after α knockdown. (b) Equal protein loadings of homogenates from control and siRNA-treated cells were subjected to SDS-PAGE, and Western blots were cut in four and probed with the indicated antibody. Anti-actin was included as a loading control. As well as affecting its target, the α siRNA causes a depletion in μ2, and the μ2 siRNA causes a depletion in α. (c) Homogenates of control and μ2-depleted cells were centrifuged at high speed, and supernatants and pellets were probed with anti-α. Knocking down μ2 increases the percentage of α in the supernatant. (d–f) Phase-contrast micrographs of cells treated with a control (nonfunctional) siRNA (d), cells treated with μ2 siRNA (e), and cells treated with clathrin heavy chain siRNA (f). The μ2 siRNA-treated cells look essentially normal. However, many of the clathrin heavy chain siRNA-treated cells are vacuolated, and nearly half are multinucleated. (g–k) Control cells (g), cells treated once with α (h) and μ2 (i) siRNAs, and cells treated twice with α (j) and μ2 (k) siRNAs were labeled with an antibody against the AP-2 α subunit. The labeling becomes patchy after one hit, and after both hits there is little or no label associated with the plasma membrane. (l–n) Control cells (l) and cells treated once (m) or twice (n) with a clathrin heavy chain siRNA were labeled with an antibody against clathrin. The signal disappears more uniformly than the AP-2 signal, again becoming undetectable on membranes after two hits. Bars, 20 μm.
Figure 2.
Figure 2.
Immunofluorescence triple labeling of control and siRNA-treated cells plated together. (a–c and g). Cells treated with μ2-2 and control cells were labeled with mouse anti-α-adaptin (a; blue in g), rabbit anti-clathrin (b; red in g), and goat anti-epsin 1 (c; green in g). α-Adaptin is cytosolic in the μ2-depleted cells. Clathrin is still membrane-associated; however, many of these membranes are intracellular. Epsin spots are reduced in number, but are still present in the μ2-depleted cells. Many of these spots are also positive for clathrin. The two boxed-in regions are shown at higher magnification in the bottom right corner of all the panels in a–c. (d–f and h) Cells treated with chc-2 and control cells were labeled with mouse anti-α-adaptin (d; blue in h), rabbit anti-clathrin (e; red in h), and goat anti-epsin (f; green in h). Clathrin is undetectable in the siRNA-treated cells. α-Adaptin labeling is not markedly different; however, epsin labeling is brighter in the clathrin-depleted cells. Bars, 20 μm.
Figure 3.
Figure 3.
Electron micrographs of control and siRNA-treated cells. The cells in these experiments were incubated with an antibody against the transferrin receptor coupled to 8-nm gold before fixation to monitor the efficiency of transferrin receptor endocytosis. (a and b) Control cells have abundant clathrin-coated pits (large arrowheads) associated with the plasma membrane. Gold particles (small arrowheads) can be seen in endosomes. (c–f) Cells were treated with μ2-2 siRNA. These cells still have clathrin-coated pits associated with the plasma membrane, but when the pits were quantified by morphometry in control and AP-2–depleted cells, they were found to be 12-fold less abundant in the AP-2–depleted cells. Morphologically, the coated pits are similar to those in control cells, but they tend to be smaller. Gold particles (small arrowheads) remain on the cell surface. A clathrin-coated bud or vesicle in the Golgi region (G) is indicated with the arrow in f. (g) Clathrin-depleted cells have no recognizable clathrin-coated pits or vesicles, either at the plasma membrane or on intracellular membranes, although COP-coated vesicles can still be seen on the cis side of the Golgi stack. In addition, membranes on the trans side of the Golgi stack are swollen. Bar, 500 nm.
Figure 4.
Figure 4.
Morphometric analysis of the EM data, using 128 images of each condition. For the control cells, 7,630 plasma membrane intersections were scored, of which 45 were coated pit intersections (0.6%). For the μ2-2–treated cells, 11,361 plasma membrane intersections were scored, of which six were coated pit intersections (0.05%). For the chc-2–treated cells, 7,585 plasma membrane intersections were scored, of which none were coated pit intersections.
Figure 5.
Figure 5.
Kinetics of ligand uptake in control and siRNA-treated cells. (a) Cells were allowed to bind 125I-labeled transferrin at 4°C, and were then shifted to 37°C for the indicated length of time, after which the medium was harvested, ligand remaining on the cell surface was released with an acid wash, the cells were solubilized with NaOH, and all three fractions were quantified and expressed as a percentage of total counts/m. The graph shows percentage of total counts recovered in the NaOH extract (i.e., internalized transferrin). Each point is derived from at least three separate experiments; the error bars show the SEM. Both μ2- and clathrin-depleted cells are strongly impaired in their ability to internalize transferrin. (b) Cells were treated exactly as in a, but using 125I-labeled EGF. Uptake is strongly inhibited in the clathrin-depleted cells, but it is not significantly different from control in the μ2-depleted cells. (c) Cells expressing a chimera consisting of the CD8 extracellular and lumenal domains fused to the LDL receptor cytoplasmic tail were incubated at 4°C with an mAb against CD8 followed by 125I-labeled protein A, and were then shifted to 37°C and treated as in a and b. Again, uptake is strongly inhibited in the clathrin-depleted cells, but similar to controls in the μ2-depleted cells. Virtually identical results were obtained using α-depleted cells, except that the effect on transferrin uptake was not quite so profound, presumably because the knockdown was less complete (not depicted).
Figure 6.
Figure 6.
Model showing interactions at the plasma membrane in control and siRNA-treated cells. In control cells, AP-2 and alternative adaptors are both recruited onto the plasma membrane, where they interact with each other and recruit clathrin through interactions mainly involving their flexible linker and appendage domains, whereas their more highly structured domains interact with phosphoinositides and with cargo. In AP-2–depleted cells, only alternative adaptors are recruited onto the plasma membrane, but these can still associate with each other (e.g., through EH domain–NPF interactions and SH3 domain–proline-rich domain interactions), and can still recruit clathrin and bring a subset of cargo proteins into the coated pit. However, without AP-2 there is less clathrin on the plasma membrane and fewer coated pits per cell, and cargo proteins that only have signals for AP-2 do not get internalized into coated vesicles. In clathrin-depleted cells, AP-2 and alternative adaptors are both recruited onto the plasma membrane, where they interact with each other and with cargo, but the membrane does not invaginate and there is no selective uptake of cargo.

Similar articles

Cited by

References

    1. Aguilar, R.C., H.A. Watson, and B. Wendland. 2003. The yeast Epsin Ent1 is recruited to membranes through multiple independent interactions. J. Biol. Chem. 278:10737–10743. - PubMed
    1. Boll, W., I. Rapoport, C. Brunner, Y. Modis, S. Prehn, and T. Kirchhausen. 2002. The mu2 subunit of the clathrin adaptor AP-2 binds to FDNPVY and YppΦ sorting signals at distinct sites. Traffic. 3:590–600. - PubMed
    1. Bonifacino, J.S., and L.M. Traub. 2003. Signals for sorting of transmembrane proteins to endosomes and lysosomes. Annu. Rev. Biochem. In press. - PubMed
    1. Chang, C.P., C.S. Lazar, B.J. Walsh, M. Komuro, J.F. Collawn, L.A. Kuhn, J.A. Tainer, I.S. Trowbridge, M.G. Farquhar, M.G. Rosenfeld, et al. 1993. Ligand-induced internalization of the epidermal growth factor receptor is mediated by multiple endocytic codes analogous to the tyrosine motif found in constitutively internalized receptors. J. Biol. Chem. 268:19312–19320. - PubMed
    1. Conner, S.D., and S.L. Schmid. 2003. a. Regulated portals of entry into the cell. Nature. 422:37–44. - PubMed

Publication types

MeSH terms