. 2003 Sep 1;198(5):693-704.
doi: 10.1084/jem.20030846.

Transcriptional Adaptation of Mycobacterium tuberculosis within Macrophages: Insights into the Phagosomal Environment

Affiliations

Transcriptional Adaptation of Mycobacterium tuberculosis within Macrophages: Insights into the Phagosomal Environment

Dirk Schnappinger et al. J Exp Med. .

Abstract

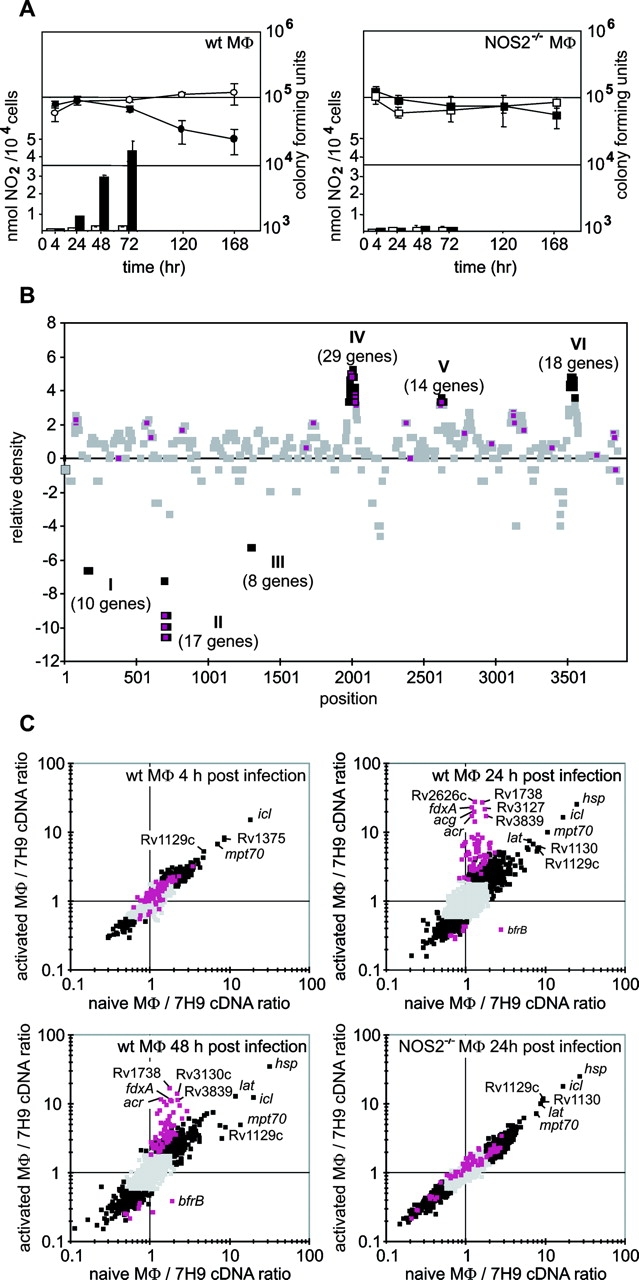
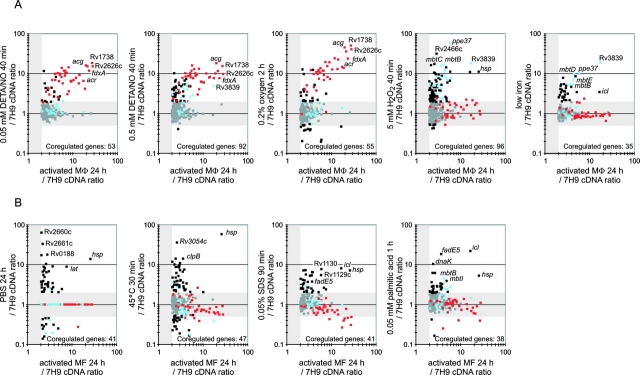
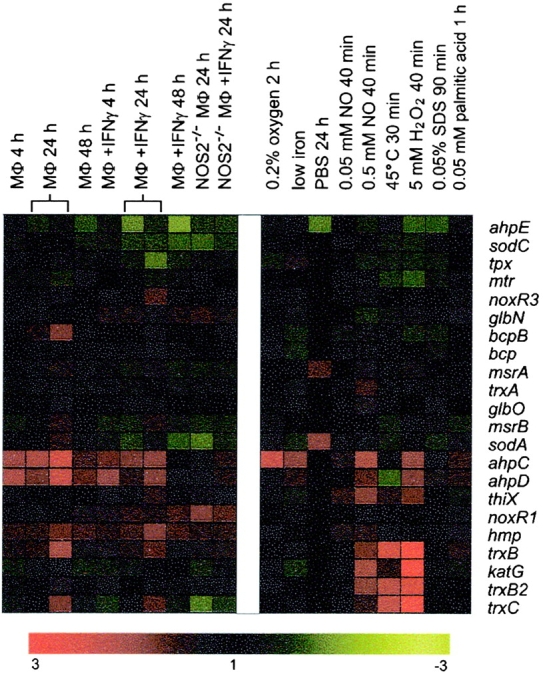
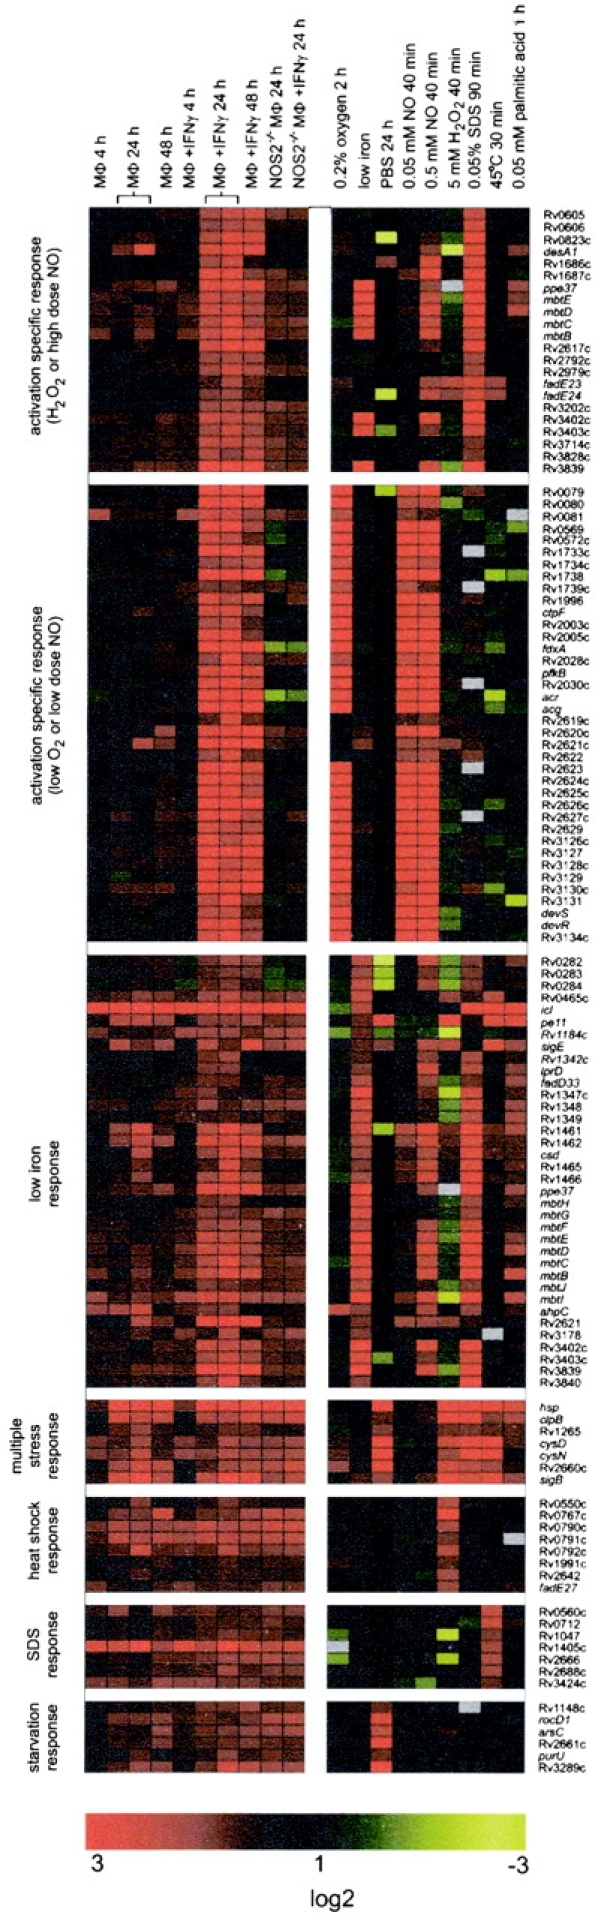
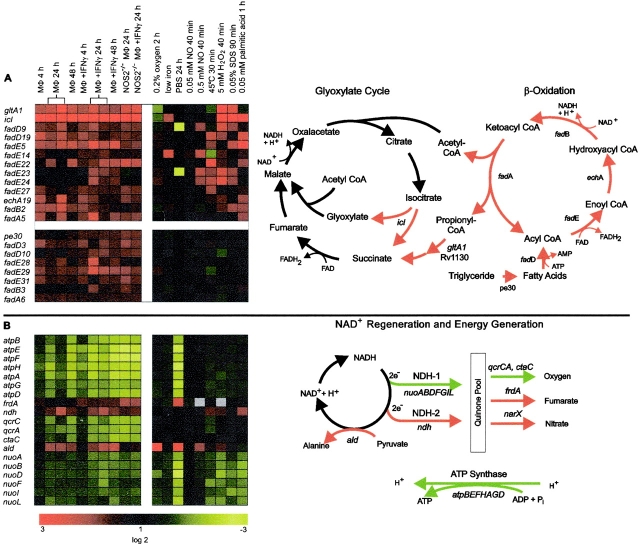
Little is known about the biochemical environment in phagosomes harboring an infectious agent. To assess the state of this organelle we captured the transcriptional responses of Mycobacterium tuberculosis (MTB) in macrophages from wild-type and nitric oxide (NO) synthase 2-deficient mice before and after immunologic activation. The intraphagosomal transcriptome was compared with the transcriptome of MTB in standard broth culture and during growth in diverse conditions designed to simulate features of the phagosomal environment. Genes expressed differentially as a consequence of intraphagosomal residence included an interferon gamma- and NO-induced response that intensifies an iron-scavenging program, converts the microbe from aerobic to anaerobic respiration, and induces a dormancy regulon. Induction of genes involved in the activation and beta-oxidation of fatty acids indicated that fatty acids furnish carbon and energy. Induction of sigmaE-dependent, sodium dodecyl sulfate-regulated genes and genes involved in mycolic acid modification pointed to damage and repair of the cell envelope. Sentinel genes within the intraphagosomal transcriptome were induced similarly by MTB in the lungs of mice. The microbial transcriptome thus served as a bioprobe of the MTB phagosomal environment, showing it to be nitrosative, oxidative, functionally hypoxic, carbohydrate poor, and capable of perturbing the pathogen's cell envelope.


Figures

Figure 1.
Figure 1.
Impact of macrophage activation on gene expression by intraphagosomal MTB. (A) Survival of MTB in macrophages (CFU) and generation of NO2 , an accumulating oxidation product of NO. Left, wild-type (wt) macrophages; right, NOS2-deficient macrophages. Open symbols and bars are for macrophages not treated with IFN-γ (“naive”) and solid symbols and bars are for IFN-γ–stimulated macrophages. NO2 secretion was measured as described 4, 24, 48, and 72 h after infection (reference 10). Means ± SD of triplicates in one experiment representative of three. (B) Distribution of differentially intraphagosomally regulated genes on the chromosome of MTB. Clusters were identified as described in Materials and Methods. Regulated genes outside of clusters are shown as gray squares, whereas genes within clusters are indicated by black squares. Centers of squares representing activation-specific genes are purple. (C) Comparison of gene regulation in MTB residing in naive or IFN-γ–stimulated macrophages. Data are averages of six (4 h after infection) or seven (24 and 48 h after infection) amplicon microarray experiments. Gray squares indicate genes regulated less than twofold in naive and activated macrophages. Black squares indicate genes regulated at least twofold in naive or activated macrophages. Purple squares indicate genes whose regulation was activation specific in wild-type macrophages. Activation-specific genes were defined as genes for which regulation in activated versus naive macrophages was significantly different (FDR <1% 24 or 48 h after infection in the amplicon array dataset and 24 h after infection in the oligonucleotide array dataset) and at least twofold different 24 h after infection. wt MΦ, wild-type macrophages; NOS2−/− MΦ, NOS2-deficient macrophages.
Figure 2.
Figure 2.
Comparison of gene regulation in IFN-γ–stimulated macrophages with gene regulation in response to various stresses in broth culture. (A) Stresses mimicking those imposed selectively by activated macrophages. Each scatter plot contains all genes induced in activated macrophages 24 h after infection (FDR <1% in oligonucleotide and amplicon array datasets, magnitude of regulation at least twofold in amplicon array dataset), most of which were also induced in resting macrophages. The x axes indicate regulation in intraphagosomal MTB and the y axes indicate regulation in culture. In each panel, squares located in the horizontal gray areas indicate genes regulated less than twofold in vitro. Red squares indicate activation-specific genes that were also induced with 0.05 mM DETA/NO and blue squares indicate activation-specific genes that were not induced with 0.05 mM DETA/NO but were induced with 5 mM H2O2. Most of the latter were also induced with 0.5 mM DETA/NO. All other genes were indicated by black squares if regulated more than twofold in culture under the conditions indicated in a given panel and by gray squares if regulated less than twofold in the same culture conditions. Thus, genes regulated similarly in naive and activated macrophages are marked by neither red nor blue. They are depicted by black or gray symbols according to their behavior under the in vitro conditions indicated. The numbers of coregulated genes give the number of all intraphagosomally induced genes that were also induced more than twofold by culture under the conditions indicated on the y axis. Data for DETA/NO, 0.2% oxygen, and low iron are from Voskuil et al. (reference 30), Sherman et al. (reference 31), and Rodriguez et al. (reference 32), respectively. (B) Stresses mimicking those imposed by both naive and activated macrophages. Data for PBS, heat shock (45°C), and SDS were from Betts et al. (reference 34), Stewart et al. (reference 35), and Manganelli et al. (reference 36), respectively. Squares are colored as described in A. Regulation for genes not reported as significantly regulated during incubation in PBS was set to 1 because primary data for these genes were not available.
Figure 4.
Figure 4.
Relative expression levels of antioxidant genes. Genes were selected based on a demonstrated or presumed antioxidant function of the encoded proteins. cDNA ratios were averaged, log2 transformed, and displayed according to the color code at the bottom of the display. The order of genes was determined by hierarchical clustering.
Figure 3.
Figure 3.
Red-green display summarizing the regulation of selected intraphagosomally induced genes. cDNA ratios were averaged, log2 transformed, and displayed according to the color code at the bottom of the display. Gray fields indicate missing data. Experimental conditions were as indicated at the top of the display. The two columns shown for intraphagosomal regulation 24 h after infection indicate data from amplicon arrays and oligonucleotide arrays, respectively. Activation-specific genes were selected as described (Figs. 1 C and 2 A). The low iron response genes are all the genes induced in IFN-γ–stimulated macrophages that were induced at least twofold during growth with low iron. The multiple stress response genes are the genes that most strongly reacted to all three of the following conditions: PBS, heat shock, and SDS. Genes labeled as heat shock, SDS, and starvation responses were genes induced more than twofold during heat shock, SDS treatment, or starvation, respectively, and induced in activated macrophages but induced less than twofold in response to all other in vitro stresses.
Figure 5.
Figure 5.
Regulation of genes encoding proteins predicted to be involved in intermediary metabolism and energy metabolism. (A) Catabolism of fatty acids. cDNA ratios were averaged, log2 transformed, and are shown in the red green display according to the color code shown in B. Experimental conditions were as indicated at the top of the display (see Fig. 2 for details). The two columns shown for intraphagosomal regulation 24 h after infection indicate data from amplicon arrays and oligonucleotide arrays, respectively. Genes were selected based on their annotation (reference 15) and grouped into those that were either regulated in response to at least one of the in vitro stresses or by none of them. Red arrows in the graphical representation of the β-oxidation and glyoxylate cycles indicate reactions that we infer to be induced in intraphagosomal MTB based on the pattern of gene expression. MΦ, macrophages. (B) Energy generation and NAD+ regeneration. Genes were selected based on their annotation and ordered based on their location in the chromosome. Gray field indicates missing data. On the amplicon arrays, narX was only represented by a DNA that also contained unspecific PCR products and is therefore not included in the red-green display. Regulation of narX in the oligonucleotide array dataset was activation specific (1.3 ± 0.4 [mean ± SEM] in naive macrophages vs. 5.2 ± 1.2 in activated macrophages 24 h after infection). Red and green arrows in the graphical representation indicate reactions that we infer to be induced (red) and repressed (green) in intraphagosomal MTB based on the pattern of gene expression.

References

    1. Aderem, A., and D.M. Underhill. 1999. Mechanisms of phagocytosis in macrophages. Annu. Rev. Immunol. 17:593–623. - PubMed
    1. Nathan, C., and M.U. Shiloh. 2000. Reactive oxygen and nitrogen intermediates in the relationship between mammalian hosts and microbial pathogens. Proc. Natl. Acad. Sci. USA. 97:8841–8848. - PMC - PubMed
    1. Finlay, B.B., and S. Falkow. 1997. Common themes in microbial pathogenicity revisited. Microbiol. Mol. Biol. Rev. 61:136–169. - PMC - PubMed
    1. Amer, A.O., and M.S. Swanson. 2002. A phagosome of one's own: a microbial guide to life in the macrophage. Curr. Opin. Microbiol. 5:56–61. - PubMed
    1. Russell, D.G. 2001. Mycobacterium tuberculosis: here today, and here tomorrow. Nat. Rev. Mol. Cell Biol. 2:569–577. - PubMed

Publication types

MeSH terms