. 2003 Sep 1;198(5):705-13.
doi: 10.1084/jem.20030205.

Inhibition of respiration by nitric oxide induces a Mycobacterium tuberculosis dormancy program

Affiliations

Inhibition of respiration by nitric oxide induces a Mycobacterium tuberculosis dormancy program

Martin I Voskuil et al. J Exp Med. .

Abstract

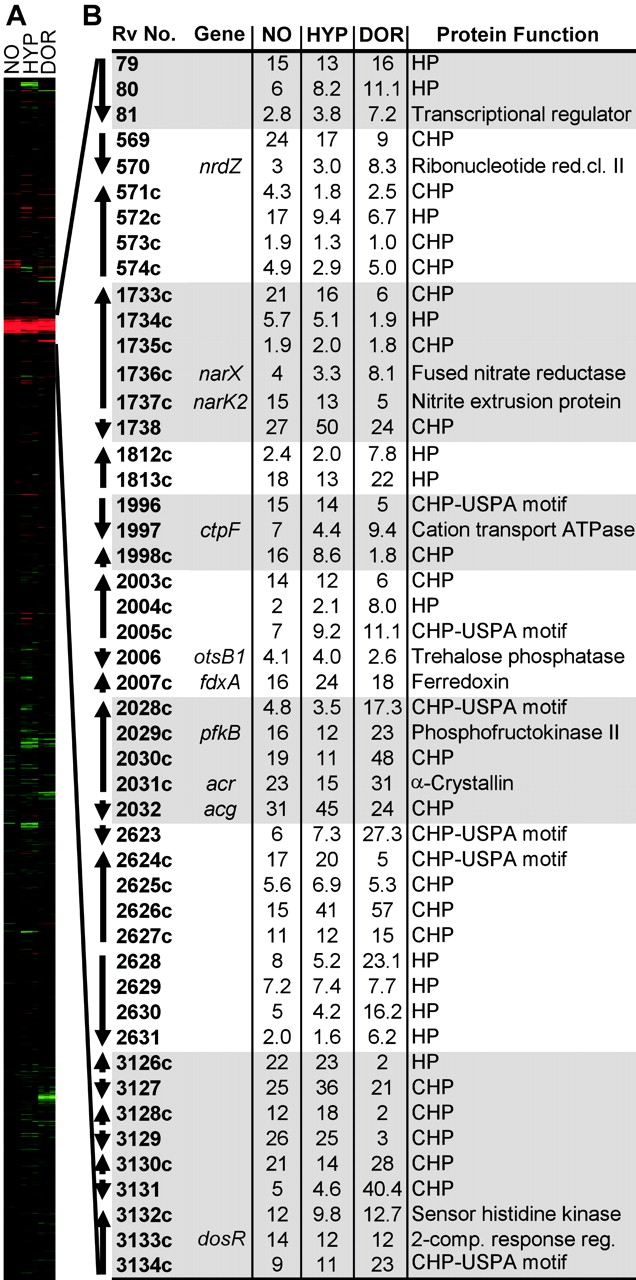
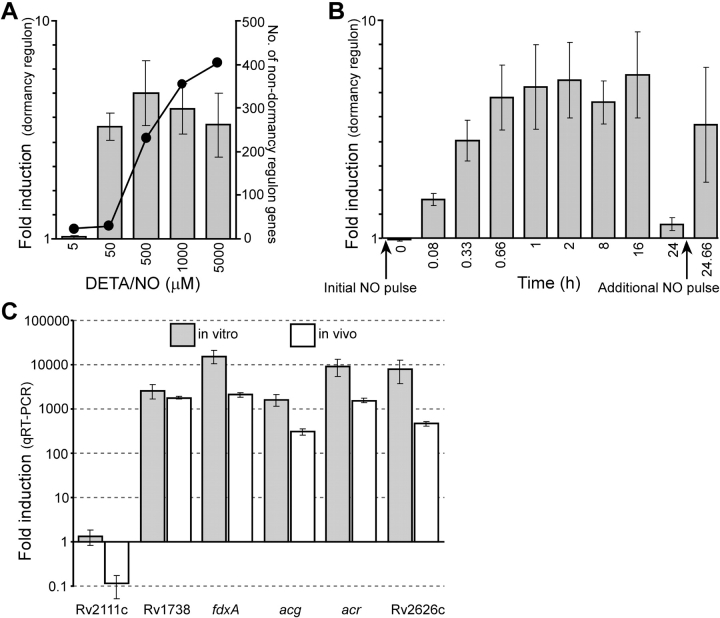
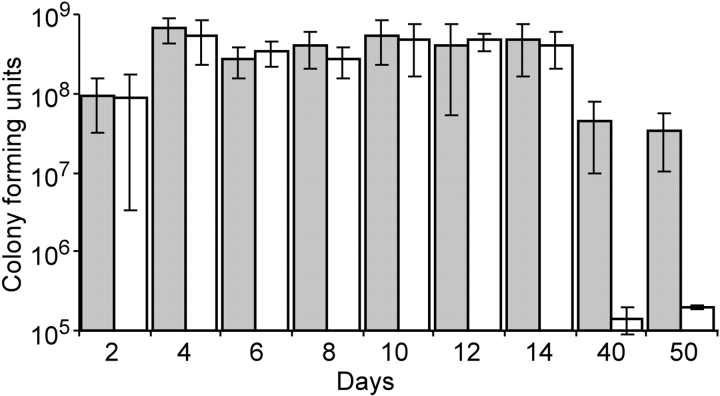
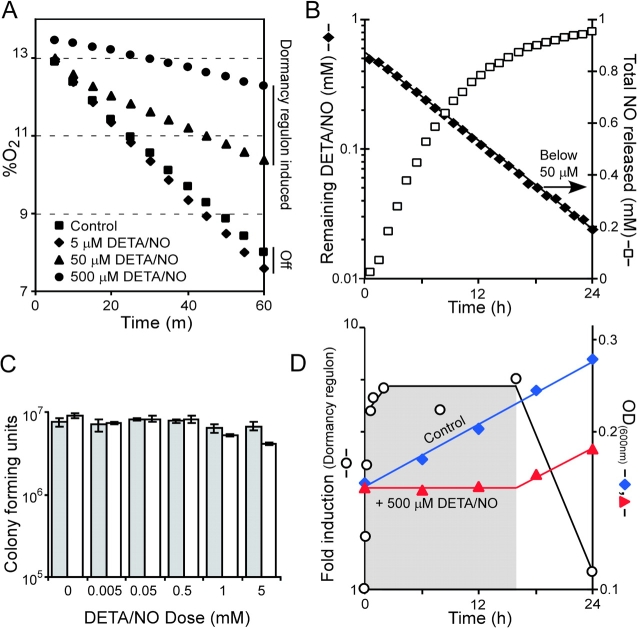
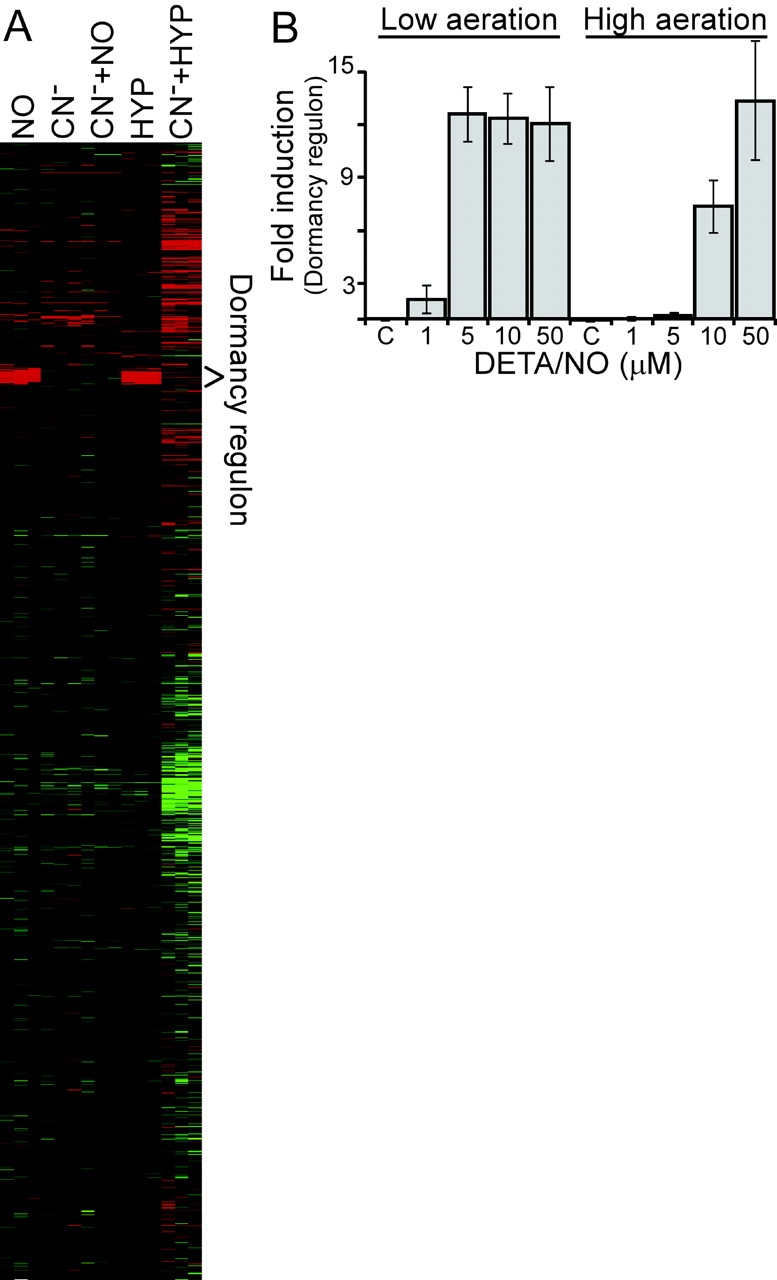
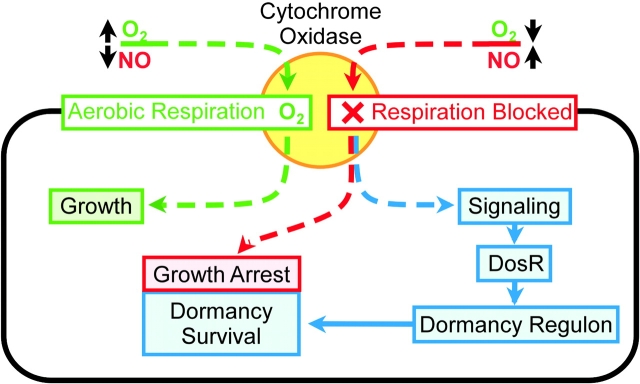
An estimated two billion persons are latently infected with Mycobacterium tuberculosis. The host factors that initiate and maintain this latent state and the mechanisms by which M. tuberculosis survives within latent lesions are compelling but unanswered questions. One such host factor may be nitric oxide (NO), a product of activated macrophages that exhibits antimycobacterial properties. Evidence for the possible significance of NO comes from murine models of tuberculosis showing progressive infection in animals unable to produce the inducible isoform of NO synthase and in animals treated with a NO synthase inhibitor. Here, we show that O2 and low, nontoxic concentrations of NO competitively modulate the expression of a 48-gene regulon, which is expressed in vivo and prepares bacilli for survival during long periods of in vitro dormancy. NO was found to reversibly inhibit aerobic respiration and growth. A heme-containing enzyme, possibly the terminal oxidase in the respiratory pathway, likely senses and integrates NO and O2 levels and signals the regulon. These data lead to a model postulating that, within granulomas, inhibition of respiration by NO production and O2 limitation constrains M. tuberculosis replication rates in persons with latent tuberculosis.


Figures

Figure 1.
Figure 1.
Dormancy regulon. Comparison of microarray expression results from M. tuberculosis strain 1254 exposed for 40 min to 50 μM of the NO donor DETA/NO (NO), and strain H37Rv exposed for 2 h to 0.2% O2 (hypoxia-HYP) and at day 4 during the gradual adaptation, to low O2 as described previously (11), resulting in an in vitro dormant state (DOR). DNA microarrays were used for the NO and low O2 experiments, whereas oligonucleotide microarrays were used for the DOR experiments. (A) All M. tuberculosis genes are represented and organized based on their regulatory profile by average linkage clustering, using the Cluster and Treeview programs. Red indicates induced, green indicates repressed, and black indicates no change in gene expression. (B) The initial selection of genes in the dormancy regulon was based on their coinduction by NO, low O2, and adaptation to an in vitro dormant state, as well as their failure to be induced in the presence of KCN (see Fig. 3 A). Rv numbers designate genes in genomic order, and arrows indicate transcript direction. Annotations are from TubercuList (http://genolist.pasteur.fr/TubercuList; reference 34). CHP and HP indicate conserved hypothetical and hypothetical proteins.
Figure 2.
Figure 2.
Dormancy regulon gene expression as measured by DNA microarray and qRT-PCR. (A) Average fold induction of all 48 genes as measured by DNA microarray after a 40 min DETA/NO exposure (left y axis); number of nondormancy regulon genes regulated at least twofold (curve; right y axis). (B) Temporal pattern of regulon induction after addition of 500 μM DETA/NO. (C) Quantitative in vitro and in vivo (infected mouse lung) induction ratios of the five regulon genes were obtained by qRT-PCR (35). Rv2111c was used as an NO-independent control gene. Gene induction ratios were calculated by first determining the copy number of each transcript normalized to the copy number of the major housekeeping sigma factor gene of M. tuberculosis, sigA. sigA mRNA remained constant during exposure to 50 μM DETA/NO (ratio 1:1 as measured by DNA microarray). The normalized copy numbers were compared with mRNA from midlogarithmic phase in vitro grown bacteria. Induction ratios are indicated by gray bars for in vitro exposure to 50 μM DETA/NO for 40 min, and white bars indicate in vivo infection, 21 d after challenge.
Figure 3.
Figure 3.
Survival of a dormancy regulon mutant during a low O2–induced dormant state. The wild-type H37Rv parent (gray bars) and the Rv3134c mutant (white bars) were grown in the low O2–induced dormancy model as described by Wayne and Hayes (11). Bacilli cultures were stirred in sealed test tubes to generate a slow depletion of O2 via culture respiration. Test tubes were opened to remove samples for colony forming unit determination at each time point and discarded.
Figure 4.
Figure 4.
NO-mediated respiratory inhibition and reversible bacteriostasis. (A) The effect of 5, 50, and 500 μM DETA/NO on M. tuberculosis respiration and dormancy regulon induction. DETA/NO was added to a well-aerated 250 ml H37Rv stirring culture and the flask was sealed. A probe measured the depletion of O2 by bacterial respiration. (B) Rate of DETA/NO decomposition and NO release. DETA/NO release of NO was monitored by absorbance at 252 nm in a 0.1 M phosphate buffer at pH 6.6 and 37°C. A standard curve was generated with known concentrations of DETA/NO to determine the molar absorptivity and used to calculate the DETA/NO concentration (closed diamonds) over time using Beer's law. One mole of DETA/NO decomposes to release 2 mol NO; therefore, the total NO released (open squares) was calculated by doubling the number of moles of DETA/NO decayed. (C) Survival of M. tuberculosis 1254 monitored by colony-forming units after exposure to various doses of DETA/NO for 4 (gray bars) and 24 h (white bars). (D) Growth inhibition by NO overlaid with the induction of the dormancy regulon. Average induction of dormancy regulon over time after addition of 500 μM DETA/NO (left y axis); optical density of control culture and culture exposed to 500 μM DETA/NO (right y axis). Refer to Fig. 4 B for the kinetics of NO production and DETA/NO consumption over the same time course after the addition of 500 μM DETA/NO. NO caused a state of bacteriostasis over ∼16 h. Resumption of growth coincided with the disappearance of NO as indicated by reduction of regulon expression to basal levels (gray area) and decomposition of the NO donor (B).
Figure 5.
Figure 5.
Competition between O2 and NO for heme-containing protein. (A) Average linkage clustering comparison of expression data from all M. tuberculosis genes after a 40-min exposure to 50 μM DETA/NO, 50 μM KCN, KCN plus DETA/NO, 2-h hypoxia, and 500 μM KCN plus 2-h hypoxia. (B) Competition between NO and O2 for control of dormancy regulon expression. DETA/NO was added to a 300-ml culture stirring at 100 rpm for low aeration and maximum rpm for high aeration. Induction of the regulon was assayed by DNA microarray after 40 min NO exposure.
Figure 6.
Figure 6.
Model of O2 and NO control of respiration, growth, and gene regulation. Cytochrome oxidase is posited as the sensor/integrator of O2/NO levels in this model.

References

    1. Dye, C., S. Scheele, P. Dolin, V. Pathania, and M.C. Raviglione. 1999. Consensus statement. Global burden of tuberculosis: estimated incidence, prevalence, and mortality by country. WHO Global Surveillance and Monitoring Project. JAMA. 282:677–686. - PubMed
    1. Flynn, J.L., and J. Chan. 2001. Tuberculosis: latency and reactivation. Infect. Immun. 69:4195–4201. - PMC - PubMed
    1. McKinney, J.D., K. Honer zu Bentrup, E.J. Munoz-Elias, A. Miczak, B. Chen, W.T. Chan, D. Swenson, J.C. Sacchettini, W.R. Jacobs, Jr., and D.G. Russell. 2000. Persistence of Mycobacterium tuberculosis in macrophages and mice requires the glyoxylate shunt enzyme isocitrate lyase. Nature. 406:735–738. - PubMed
    1. Betts, J.C., P.T. Lukey, L.C. Robb, R.A. McAdam, and K. Duncan. 2002. Evaluation of a nutrient starvation model of Mycobacterium tuberculosis persistence by gene and protein expression profiling. Mol. Microbiol. 43:717–731. - PubMed
    1. Wayne, L.G., and C.D. Sohaskey. 2001. Nonreplicating persistence of mycobacterium tuberculosis. Annu. Rev. Microbiol. 55:139–163. - PubMed

Publication types

MeSH terms