. 2003 Sep 1;198(5):757-69.
doi: 10.1084/jem.20030794.

Thymic medullary epithelial cell differentiation, thymocyte emigration, and the control of autoimmunity require lympho-epithelial cross talk via LTbetaR

Affiliations

Thymic medullary epithelial cell differentiation, thymocyte emigration, and the control of autoimmunity require lympho-epithelial cross talk via LTbetaR

Thomas Boehm et al. J Exp Med. .

Abstract

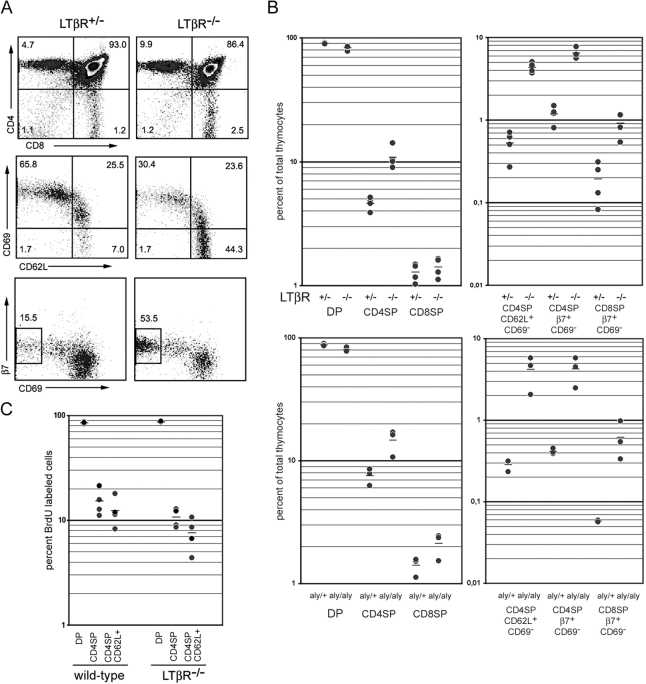
Thymocytes depend on the interaction with thymic epithelial cells for the generation of a diverse, nonautoreactive T cell repertoire. In turn, thymic epithelial cells acquire their three-dimensional cellular organization via instructive signals from developing thymocytes. The nature of these signals has been elusive so far. We show that thymocytes and medullary epithelial cells (MECs) communicate via the lymphotoxin beta receptor (LTbetaR) signaling axis. Normal differentiation of thymic MECs requires LTbetaR ligand on thymocytes and LTbetaR together with nuclear factor-kappaB-inducing kinase (Nik) in thymic epithelial cells. Impaired lympho-epithelial cross talk in the absence of the LTbetaR causes aberrant differentiation and reduced numbers of thymic MECs, leads to the retention of mature T lymphocytes, and is associated with autoimmune phenomena, suggesting an unexpected role for LTbetaR signaling in central tolerance induction.


Figures

Figure 1.
Figure 1.
Normal development of thymic MECs requires LTβR signaling. (A) UEA-1 staining reveals the disturbed differentiation of MECs in LTβR−/− and aly/aly mice. Consecutive sections of thymic lobes stained with the lectin UEA-1 for MECs and a monoclonal antibody specific for cytokeratin 8 (K8) expressed by cortical epithelial cells are shown (top and bottom, respectively). The dark line marks the border between cortex and medulla. Panels in the middle represent higher magnification images of the top panels. (B) Stainings of medullary regions of thymi of the respective mice were performed with a polyclonal rabbit antiserum directed against the nonpolymorphic MHC class II antigen I-O and the monoclonal antibody MTS10. Hematoxylin and eosin stainings (H&E) show an increased density of lymphocytes in the medulla compared with wild-type mice. Cortical areas (C) and medullary areas (M) are indicated.
Figure 2.
Figure 2.
The defect causing abnormal differentiation of MECs in LTβR−/− and aly/aly mice lies in the stroma compartment. (A) Thymus sections of the indicated bone marrow chimeras were analyzed 6–8 wk after bone marrow transfer. The middle and right panels in the top row represent consecutive sections to demonstrate the presence of wild-type thymocytes. The staining reagent is indicated in parentheses. The left panels in the top and the bottom row are low magnification images of the subsequent panels. (B) UEA-1–positive MECs in LTβR−/− and wild-type mice were counted on 10 high power fields for each genotype. (C) MECs in preparations of thymic epithelial cells of single thymi from LTβR−/− and wild-type mice were identified and counted by FACS® analysis. The overall size of LTβR−/− thymi as measured by thymocyte numbers did not significantly differ from control thymi (see Fig. 6). Histogram plots are electronically gated on cells negative for CD45 and CDR1, and the marker indicates the fluorescence intensity scored as high level UEA-1 expression. MEC numbers of four individual thymi per genotype were determined. (D) The absolute number of CD45G8.8+CDR1B7.1+ MECs from preparations of epithelial cells of pools from five mice were determined. The gate that identifies these MECs among CD45G8.8+ thymic epithelial cells is shown in Fig. 7. The results of three independent experiments for each genotype are shown. Error bars represent standard deviations from the mean and statistical analysis was done using Student's t test.
Figure 3.
Figure 3.
FACS® analysis detects LTβR ligands on thymocytes in LTβR−/− but not control mice. Histogram plots for LTβR-Fc stainings of electronically gated triple-negative (TN), coreceptor double-positive (DP), and CD4 and CD8 single-positive (CD4SP and CD8SP) thymocyte subsets for mice of the indicated genotypes are shown. TN cells are defined as thymocytes negative for CD4, CD8, CD3ɛ, and TCRβ. The gray lines show background staining levels without the fusion protein. One representative staining of at least four for each genotype is shown.
Figure 4.
Figure 4.
Mice deficient for the LTβR ligand LTα1β2 show disturbed differentiation of MECs. (A) UEA-1 stainings of thymic medullary regions of LTβR−/−, LTβ −/−LIGHT−/−, LTβ −/−LIGHT+/− and LTβ +/−LIGHT+/− mice. The panels show representative medullary areas from 8-wk-old LTβR ligand–deficient mice of the same litter processed on the same slide. The dark line marks the border between cortex and medulla. (B) Quantification of the surface area of UEA-1–positive MECs in LTβR−/−, LTβ−/−LIGHT−/−, LTβ −/−LIGHT+/−, and LTβ +/−LIGHT+/− mice. Brown pixels (i.e., UEA-1 staining) were counted from 10 digital images of each genotype using the public domain software NIH image. Results are given as square pixels per 6.25 × 10⁻⁸ m2 thymic medulla.
Figure 5.
Figure 5.
The three-dimensional organization of thymic MECs depends on continuous signaling through LTβR. C57BL/6 wild-type mice received intraperitoneal injections of LTβR-Fc or human polyclonal IgG as control once a week for 3 and 6 wk, respectively. (A) Thymi were stained with UEA-1 and medullary regions are shown. (B) Quantification of the surface area of UEA-1–positive MECs in thymi from LTβR-Fc–treated mice. Brown pixels (i.e., UEA-1 staining) were counted from 10 digital images derived from multiple sections of each experimental condition using the public domain software NIH image.
Figure 6.
Figure 6.
The absence of LTβR signaling leads to the accumulation of thymocytes with the phenotype of recent thymic emigrants. (A) FACS® analysis of thymocytes in LTβR−/− mice and heterozygous controls. Thymocytes of 12-wk-old mice were stained with the indicated antibodies and gated on lymphocytes for the top panels and on CD4 single-positive cells (CD4SP) for the middle and bottom panels. Total thymocyte numbers did not differ significantly between mutant mice and appropriate controls (1.19 ± 0.27 × 10⁸ per LTβR−/− thymus and 1.68 ± 0.37 × 10⁸ per LTβR+/− control thymus; 1.43 ± 0.58 × 10⁸ per aly/aly thymus and 1.77 ± 0.46 × 10⁸ per aly/+ control thymus). Percent of cells in each quadrant are indicated. For the bottom panel, the percent of integrin β7+ CD69 cells among CD4SP in the indicated box is given. (B) Quantification of thymocyte subsets in LTβR−/−, aly/aly, and heterozygous control mice. Thymocytes from 12-wk-old mice were stained as shown in A. Results are shown as percent of total thymocytes. Each dot indicates one mouse and the mean percentage is indicated by a horizontal bar. (C) 12-wk-old LTβR−/− mice and appropriate wild-type controls were injected with BrdU once and kept on BrdU containing drinking water for 3 d, after which the indicated thymocyte subpopulations were sorted by FACS® and stained with a FITC-labeled anti-BrdU monoclonal antibody. The percentage of cells that incorporated BrdU was determined. Each dot indicates one mouse and the mean percentage is indicated by a horizontal bar.
Figure 7.
Figure 7.
LTβR−/− mice show signs of autoimmunity. (A) The FACS® plot shows thymic epithelial cells electronically gated on CD45-negative G8.8-positive cells. CD45G8.8+CDR1B7.1+ MECs were isolated by FACS® from wild-type and LTβR−/− mice using the indicated gate. Semi-quantitative RT-PCR results of undiluted, 5-fold, and 25-fold diluted cDNAs for several tissue-specific transcripts, HPRT, and AIRE are shown. (B) The presence of autoantibodies directed against salivary gland, pancreas, and stomach was detected in sera from LTβR−/− but not control mice. Immunohistochemistry was performed on sections of tissues isolated from RAG2−/− mice using 1:40 dilutions of the indicated sera. Images were obtained by confocal microscopy with identical settings for all samples shown.

References

    1. Weissman, I.L. 1973. Thymus cell maturation. Studies on the origin of cortisone-resistant thymic lymphocytes. J. Exp. Med. 137:504–510. - PMC - PubMed
    1. Kyewski, B.A. 1987. Seeding of thymic microenvironments defined by distinct thymocyte-stromal cell interactions is developmentally controlled. J. Exp. Med. 166:520–538. - PMC - PubMed
    1. van Ewijk, W., G. Hollander, C. Terhorst, and B. Wang. 2000. Stepwise development of thymic microenvironments in vivo is regulated by thymocyte subsets. Development. 127:1583–1591. - PubMed
    1. Laufer, T.M., L.H. Glimcher, and D. Lo. 1999. Using thymus anatomy to dissect T cell repertoire selection. Semin. Immunol. 11:65–70. - PubMed
    1. Klein, L., M. Klugmann, K.A. Nave, V.K. Tuohy, and B. Kyewski. 2000. Shaping of the autoreactive T-cell repertoire by a splice variant of self protein expressed in thymic epithelial cells. Nat. Med. 6:56–61. - PubMed

Publication types

MeSH terms