. 2003 Sep 1;198(5):809-21.
doi: 10.1084/jem.20021358.

Impaired T cell death and lupus-like autoimmunity in T cell-specific adapter protein-deficient mice

Affiliations

Impaired T cell death and lupus-like autoimmunity in T cell-specific adapter protein-deficient mice

Jorn Drappa et al. J Exp Med. .

Abstract

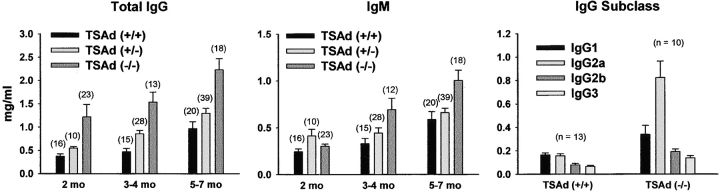
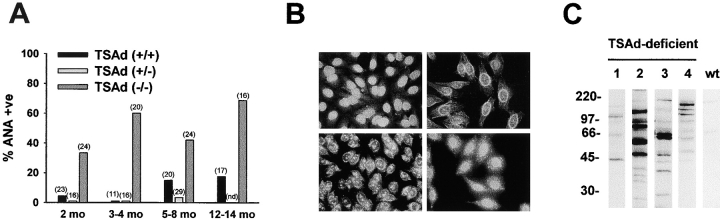
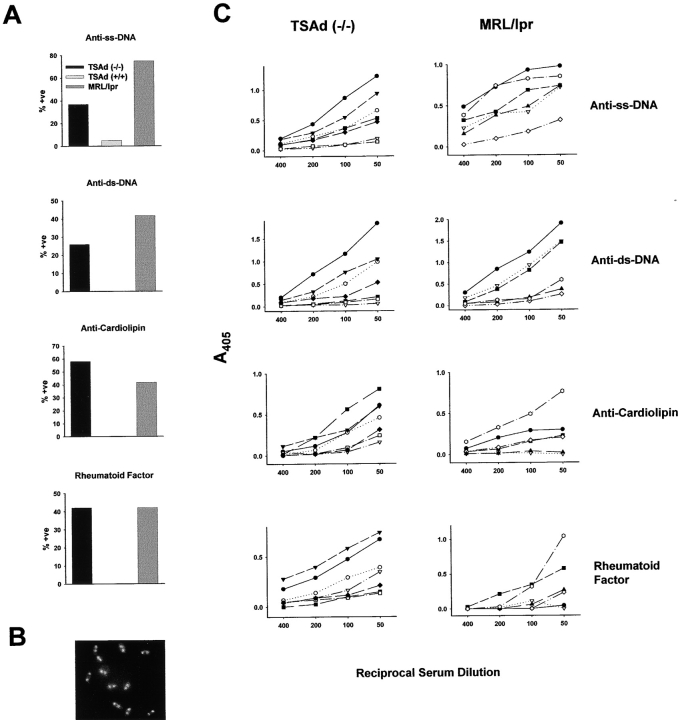
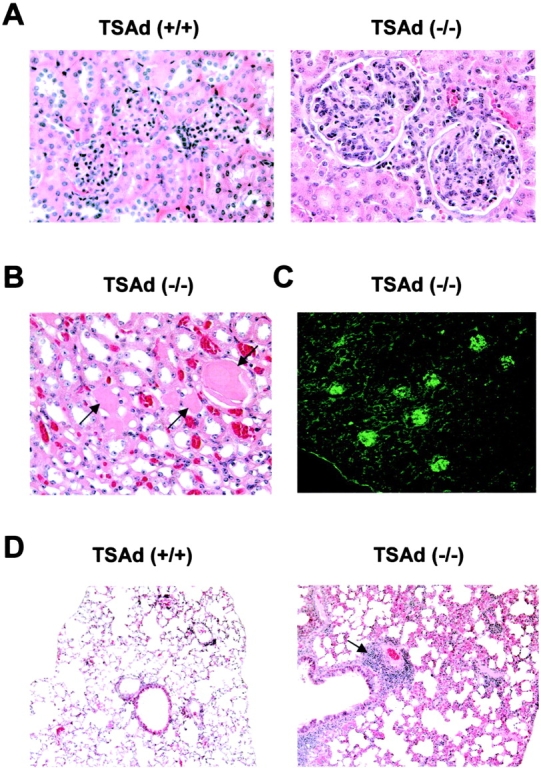
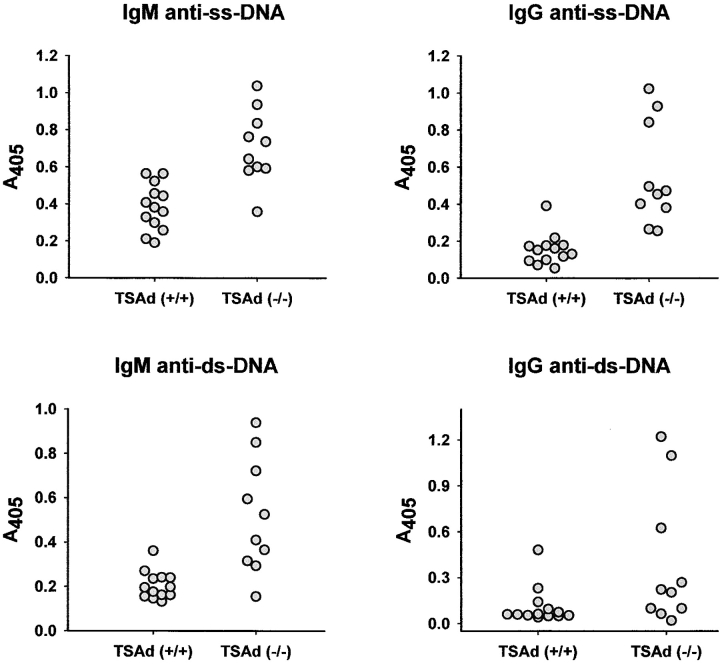
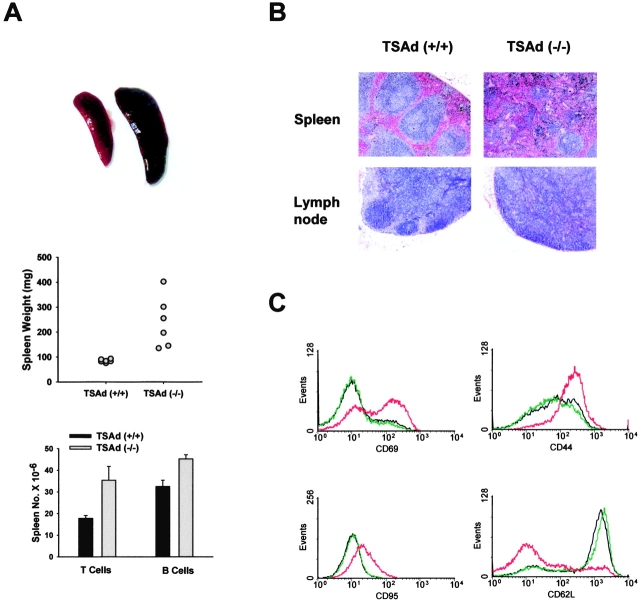
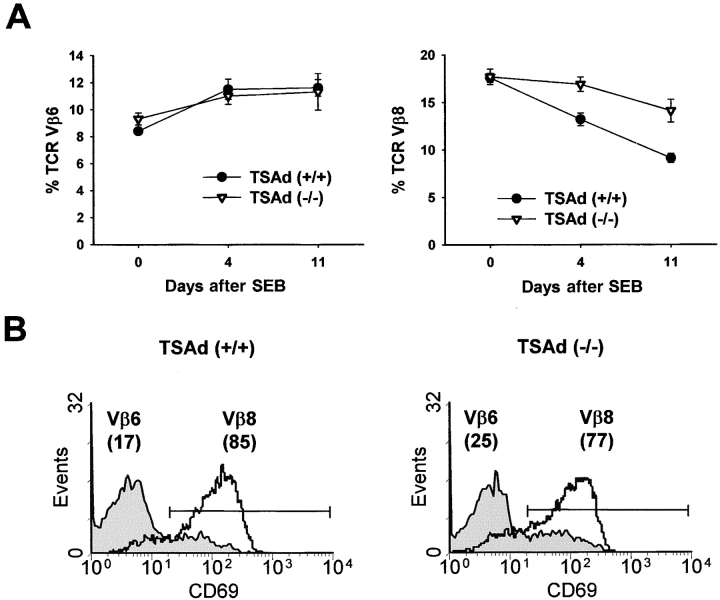
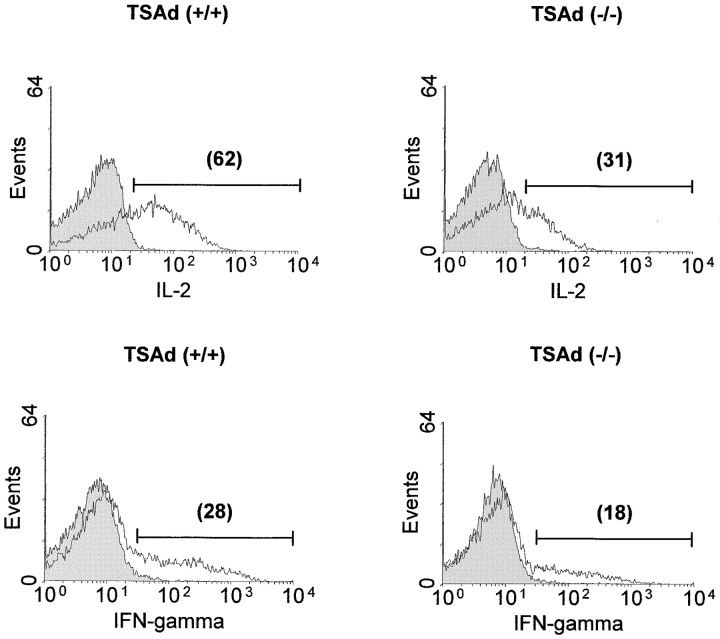
T cell-specific adaptor protein (TSAd) is a T lineage-restricted signaling adaptor molecule that is thought to participate in the assembly of intracellular signaling complexes in T cells. Previous studies of TSAd-deficient mice have revealed a role for TSAd in the induction of T cell interleukin 2 secretion and proliferation. We now show that TSAd-deficient mice are susceptible to lupus-like autoimmune disease. On the nonautoimmune-prone C57BL/6 genetic background, TSAd deficiency results in hypergammaglobulinemia that affects all immunoglobulin (Ig)G subclasses. Older C57BL/6 TSAd-deficient mice (1 yr of age) accumulate large numbers of activated T and B cells in spleen, produce autoantibodies against a variety of self-targets including single stranded (ss) and double stranded (ds) DNA, and, in addition, develop glomerulonephritis. We further show that immunization of younger C57BL/6 TSAd-deficient mice (at age 2 mo) with pristane, a recognized nonspecific inflammatory trigger of lupus, results in more severe glomerulonephritis compared with C57BL/6 controls and the production of high titer ss and ds DNA antibodies of the IgG subclass that are not normally produced by C57BL/6 mice in this model. The development of autoimmunity in TSAd-deficient mice is associated with defective T cell death in vivo. These findings illustrate the role of TSAd as a critical regulator of T cell death whose absence promotes systemic autoimmunity.


Figures

Figure 1.
Figure 1.
Serum Ig levels in TSAd-deficient mice. Concentrations of total IgG, IgM, and different IgG subclasses in sera from TSAd-deficient (−/−) and littermate control wild-type (+/+) and TSAd heterozygote (+/−) mice at the indicated ages were determined by ELISA (IgG subclass analyses were performed upon 3–4-mo-old mice). Data are represented as mean plus 1 SE. Except for IgM at 2 mo, all increases in Ig concentration in TSAd-deficient mice (relative to wild-type mice) are statistically significant (all P < 0.05 using Student's two-sample t test). Increases in Ig concentrations seen in TSAd heterozygotes (relative to wild-type) are statistically significant only for IgG at 2 and 3–4 mo. Within each genotype and age group category mixed numbers of males and females were analyzed (total numbers are shown in parentheses above bars). Increases in Ig concentrations seen in TSAd-deficient mice were independent of gender (see Fig. S1, available at http://www.jem.org/cgi/content/full/jem.20021358/DC1).
Figure 2.
Figure 2.
ANA in sera from TSAd-deficient mice. (A) The presence of ANA antibodies in sera from TSAd-deficient and littermate control wild-type and TSAd heterozygote mice was determined by immunofluorescent staining of HEp-2 epithelial cells. Shown is the percentage of ANA+ sera for each genotype at the indicated ages (total numbers of mice analyzed are shown in parentheses). Differences between TSAd-deficient and wild-type control mice are statistically significant in all age groups (all P < 0.05 calculated using the chi-squared test of independence). nd, not determined. (B) Different patterns of nuclear staining of HEp-2 epithelial cells observed with TSAd-deficient sera. Clockwise from top left: homogenous nuclear, rim, homogenous nuclear with cytoplasmic dots, and nucleolar with cytoplasmic dots. (C) Reactivity of sera from four 7–9-mo-old ANA+ TSAd-deficient mice and age-matched control wild-type (wt) mice with proteins in nuclear lysates of T leukemia cells as detected by Western blotting. The wild-type serum was pooled from three different wild-type mice.
Figure 3.
Figure 3.
Reactivity of TSAd-deficient sera with self-antigens. (A) The presence of IgG antibodies against ss DNA, ds DNA, cardiolipin, and IgG in sera from 1-yr-old TSAd-deficient (n = 19), 1-yr-old control C57BL/6 wild-type (n = 18, except for anti-ss DNA where n = 20), and 3–6-mo-old MRL/lpr (n = 12) mice was determined by ELISA. Sera were tested at a dilution of 1:50 and were scored positive based on criteria outlined in Materials and Methods. Shown is the percentage of positive sera for each autoantigen. Differences between TSAd-deficient and C57BL/6 mice are statistically significant for all autoantigens (all P < 0.05 determined using the chi-squared test). (B) Representative staining of Crithidia luciliae by TSAd-deficient sera that scored positive for anti-ds DNA antibodies by ELISA. Shown is intense staining of the ds DNA-containing kinetochore and the dimmer staining nucleus. Reactivity with the kinetochore (which is free of ss DNA and not complexed to protein) confirms the presence of anti-ds DNA antibodies. (C) Titers of autoantibodies in TSAd-deficient and MRL/lpr mice. Reactivity of diluted sera from seven 1-yr-old TSAd-deficient mice and six 4–6-mo-old MRL/lpr mice with the indicated autoantigens was determined by ELISA as indicated in A. Data from individual mice are represented by different symbols. For each mouse the same symbol is used for each antigen.
Figure 4.
Figure 4.
Kidney and lung pathology of TSAd-deficient mice. (A and B) H&E stained kidney sections from 1-yr-old control wild-type and TSAd-deficient mice. Representative glomeruli are shown in A. Note gross increase in mesangial cellularity in TSAd-deficient glomeruli. (B) Intratubular hyaline casts (indicated by arrows) seen in TSAd-deficient kidneys. (C) IgG immune complex deposits in glomeruli of a 9-mo-old TSAd-deficient mouse detected by immunofluorescence. (D) H&E stained lung sections from 1-yr-old control wild-type and TSAd-deficient mice. Note perivascular inflammatory aggregate (indicated by arrow) and thickening of alveolar interstitial spaces in the TSAd-deficient lung.
Figure 5.
Figure 5.
Pristane induction of anti-DNA antibodies in TSAd-deficient mice. Control wild-type and TSAd-deficient mice were immunized with pristane at 2 mo of age. 6 mo after immunization, the presence of the indicated anti-DNA antibodies in sera was determined by ELISA. All sera were tested at a dilution of 1:100. Data points represent different individual mice of the indicated genotypes. The difference in mean OD value for IgM anti-ss DNA antibodies between wild-type and TSAd-deficient mice is statistically significant (P < 3.6 × 10⁻⁴ determined using the Student's two-sample t test). Differences between wild-type and TSAd-deficient mice with respect to the percentage of mice that develop the other types of anti-DNA antibodies (see text and Materials and Methods) are also statistically significant (all P < 5 × 10⁻⁵ determined using the chi-squared test).
Figure 6.
Figure 6.
Splenic pathology of TSAd-deficient mice. (A) Top: spleens from 9-mo-old wild-type (left) and TSAd-deficient (right) mice. Middle: spleen weights of six 1-yr-old wild-type and TSAd-deficient mice. Bottom: the total number of T cells and B cells in spleens from three 1-yr-old wild-type and TSAd-deficient mice were determined. (B) H&E stained spleen and inguinal lymph node sections from 1-yr-old wild-type and TSAd-deficient mice. Note the loss of normal architecture (clearly defined areas of red and white pulp in spleen and cortical and medullary regions in lymph node) in TSAd-deficient mice. (C) Expression of the indicated activation markers on splenic T cells from 9-mo-old wild-type (blue or green) and TSAd-deficient (red) mice was determined by flow cytometry.
Figure 7.
Figure 7.
Defective T cell death in TSAd-deficient mice. (A) Percentages of TCR Vβ6+ or TCR Vβ8+ T cells amongst total CD4+ T cells in venous blood from wild-type and TSAd-deficient mice (age 2 mo) at the indicated times after immunization with SEB were determined by flow cytometry. Data are from eight mice in each group and are represented as means ± 1 SE. At days 4 and 11 differences between wild-type and TSAd-deficient mice with respect to the percentage of Vβ8+ T cells are statistically significant (both P < 0.005 calculated using the Student's two sample t test). (B) CD69 expression on TCR Vβ6+ and Vβ8+ T cells from wild-type and TSAd-deficient mice 24 h after immunization with SEB was determined by flow cytometry. The percentages of Vβ6+ and Vβ8+ T cells that express CD69 are indicated in parentheses.
Figure 8.
Figure 8.
Genes positively regulated by TSAd in CD4+ T cells. Purified CD4+ splenic T cells from 2-mo-old wild-type (WT) and TSAd-deficient (KO) mice were not stimulated (0) or stimulated with CD3 plus CD28 antibodies for 20 h (20) in vitro. Relative gene expression in unstimulated and stimulated T cells was determined in gene profiling experiments using Affymetrix U74Av2 microchips. Shown are those genes (107 total out of ∼12,000) where WT (20) > WT (0) by a factor of at least threefold, WT (20)/KO (20) > WT (0)/KO (0) by at least 1.5-fold, and WT (20) > KO (20) by at least 1.5-fold. Genes are categorized on the basis of known or inferred (based on amino acid sequence homology) function. For each gene the WT/KO ratio at 20 h is depicted. For all data values for this gene set see Tables S1–S8, available at http://www.jem.org/cgi/content/full/jem.20021358/DC1.
Figure 9.
Figure 9.
Impaired cytokine production by TSAd-deficient T cells in vivo. Control wild-type and TSAd-deficient mice were immunized with SEB. After 24 h, IL-2 and IFN-γ expression in Vβ8+ splenic T cells was determined by intracellular staining and flow cytometry. Filled and open histograms represent isotype control and anticytokine-stained Vβ8+ T cells, respectively. The percentages of cytokine+ Vβ8+ T cells are indicated in parentheses.

References

    1. Spurkland, A., J.E. Brinchmann, G. Markussen, F. Pedeutour, E. Munthe, T. Lea, F. Vartdal, and H.C. Aasheim. 1998. Molecular cloning of a T cell-specific adapter protein (TSAd) containing an Src homology (SH) 2 domain and putative SH3 and phosphotyrosine binding sites. J. Biol. Chem. 273:4539–4546. - PubMed
    1. Choi, Y.B., C.K. Kim, and Y. Yun. 1999. Lad, an adapter protein interacting with the SH2 domain of p56lck, is required for T cell activation. J. Immunol. 163:5242–5249. - PubMed
    1. Rajagopal, K., C.L. Sommers, D.C. Decker, E.O. Mitchell, U. Korthauer, A.I. Sperling, C.A. Kozak, P.E. Love, and J.A. Bluestone. 1999. RIBP, a novel Rlk/Txk- and itk-binding adaptor protein that regulates T cell activation. J. Exp. Med. 190:1657–1668. - PMC - PubMed
    1. Sun, W., K. Kesavan, B.C. Schaefer, T.P. Garrington, M. Ware, N.L. Johnson, E.W. Gelfand, and G.L. Johnson. 2001. MEKK2 associates with the adapter protein Lad/RIBP and regulates the MEK5-BMK1/ERK5 pathway. J. Biol. Chem. 276:5093–5100. - PubMed
    1. Marti, F., N.H. Post, E. Chan, and P.D. King. 2001. A transcription function for the T cell–specific adapter (TSAd) protein in T cells: critical role of the TSAd Src homology 2 domain. J. Exp. Med. 193:1425–1430. - PMC - PubMed

Publication types

MeSH terms