. 2003 Sep;15(9):1990-2002.
doi: 10.1105/tpc.014423.

Secretory low molecular weight phospholipase A2 plays important roles in cell elongation and shoot gravitropism in Arabidopsis

Affiliations

Secretory low molecular weight phospholipase A2 plays important roles in cell elongation and shoot gravitropism in Arabidopsis

Hyoung Yool Lee et al. Plant Cell. 2003 Sep.

Abstract

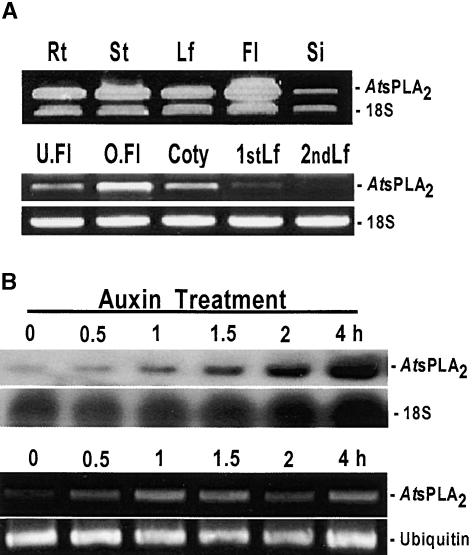
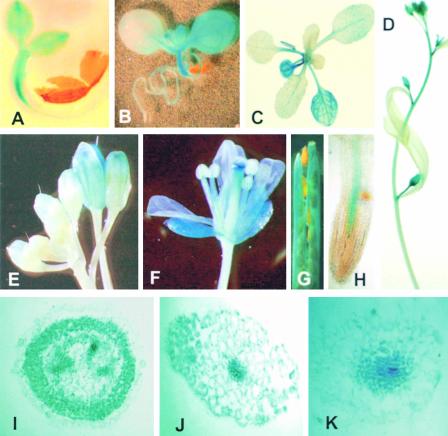
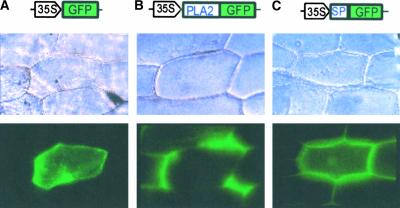
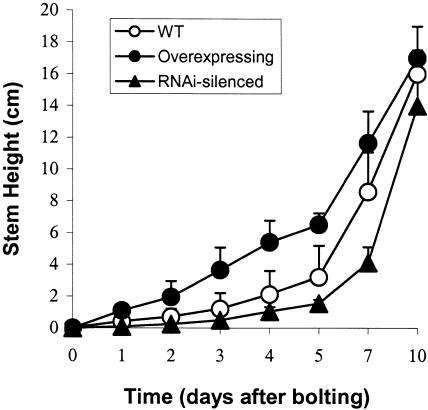
To elucidate the cellular functions of phospholipase A(2) in plants, an Arabidopsis cDNA encoding a secretory low molecular weight phospholipase A(2) (AtsPLA(2)beta) was isolated. Phenotype analyses of transgenic plants showed that overexpression of AtsPLA(2)beta promotes cell elongation, resulting in prolonged leaf petioles and inflorescence stems, whereas RNA interference-mediated silencing of AtsPLA(2)beta expression retards cell elongation, resulting in shortened leaf petioles and stems. AtsPLA(2)beta is expressed in the cortical, vascular, and endodermal cells of the actively growing tissues of inflorescence stems and hypocotyls. AtsPLA(2)beta then is secreted into the extracellular spaces, where signaling for cell wall acidification is thought to occur. AtsPLA(2)beta-overexpressing or -silenced transgenic plants showed altered gravitropism in inflorescence stems and hypocotyls. AtsPLA(2)beta expression is induced rapidly by auxin treatment and in the curving regions of inflorescence stems undergoing the gravitropic response. These results suggest that AtsPLA(2)beta regulates the process of cell elongation and plays important roles in shoot gravitropism by mediating auxin-induced cell elongation.


Figures

Figure 1.
Figure 1.
Amino Acid Sequence Comparison of AtsPLA2β with Other Plant sPLA2s and Snake Venom sPLA2 (Group IA). The cleavage sites for the removal of N-terminal signal peptides as predicted by the pSORT program are indicated by closed triangles. Residues that are conserved completely among the five sequences are indicated by black boxes, and partially conserved residues are indicated by gray boxes. The Ca2+ binding domain and the active site motif of animal sPLA2s and the corresponding domain sequences in the plant sPLA2s are underlined. The Cys residues that are conserved completely between venom sPLA2, AtsPLA2β, and the three putative plant sPLA2s are indicated by open triangles.
Figure 2.
Figure 2.
Production of Recombinant AtsPLA2β and Thin Layer Chromatography Analysis of Its Hydrolytic Activity. (A) Recombinant mature AtsPLA2β proteins were separated by 12% SDS-PAGE and stained with Coomassie blue. Lane 1, DsbC-AtsPLA2β fusion proteins purified from crude extracts of recombinant E. coli and digested with the enzyme rEK; lane 2, free mature form of AtsPLA2β isolated from the mixture shown in lane 1 with the S-Tag rEK purification kit. (B) Thin layer chromatography analysis of the hydrolytic activity of recombinant AtsPLA2β. The substrate PC is hydrolyzed into LPC and FFA by PLA2 activity. Lane 1, snake venom sPLA2; lane 2, DsbC purified from E. coli transformed with the vector pET40; lanes 3 and 4, DsbC-AtsPLA2β fusion proteins purified from E. coli transformed with pET40 containing the full-length AtsPLA2β cDNA. The total amount of protein loaded in lane 4 was twice the amount loaded in lane 3.
Figure 3.
Figure 3.
Tissue-Specific and Auxin-Induced Expression of AtsPLA2β Transcripts. (A) The top gel shows tissue-specific expression. Total RNA was isolated from the root (Rt), stem (St), leaf (Lf), flower (Fl), and silique (Si) tissues of 5-week-old plants, reverse transcribed, and used as the template for PCR with primers that amplify a 436-bp AtsPLA2β fragment and a 315-bp 18S rRNA fragment. The primers used to amplify the 18S fragment were a mixture of 18S primers and 18S competitors (1:9, v/v). Thirty-five cycles of RT-PCR were used to amplify both AtsPLA2β and 18S rRNA fragments. The bottom gels show developmental stage–specific expression. Total RNA was isolated from unopened flowers (U.Fl) and opened flowers (O.Fl) of 5-week-old plants and from cotyledons (Coty), primary leaves (1stLf), and secondary leaves (2ndLf) of 2-week-old plants. Thirty-five cycles of RT-PCR were used to amplify AtsPLA2β, and 20 cycles were used to amplify 18S fragments with 18S primers without 18S competitors. (B) The top gels show RNA gel blot results. Total RNA was extracted from 10-day-old seedlings in a Petri dish at 0, 0.5, 1, 1.5, 2, and 4 h after treatment with 20 μM indoleacetic acid. The blot membrane with the AtsPLA2β probe was exposed to x-ray film for 15 days, and the blot membrane with the 18S rRNA probe was exposed for 1 day. The bottom gels show RT-PCR results with mRNA isolated from total RNA. Twenty-nine and 20 cycles of RT-PCR were used to amplify AtsPLA2β and ubiquitin fragments, respectively.
Figure 4.
Figure 4.
Histochemical Localization of GUS Activity in Arabidopsis (Col-0) Plants Transformed with the AtsPLA2β Promoter–GUS Construct. (A) A 2-day-old seedling. (B) A 6-day-old seedling. (C) A 3-week-old plant. (D) Inflorescence stems from a 4-week-old plant. (E) and (F) Floral tissues from a 5-week-old plant. (G) Silique tissues from a 6-week-old plant. (H) Roots from a 4-week-old plant. (I) Cross-section of the young inflorescence stem of a 5-week-old plant. (J) Cross-section of the hypocotyl of a 10-day-old plant. (K) Cross-section of the main root of a 2-week-old plant.
Figure 5.
Figure 5.
Subcellular Localization of AtsPLA2β Proteins. GFP fusion constructs under the control of the 35S promoter of Cauliflower mosaic virus were introduced into onion epidermal cells by particle bombardment. A construct encoding only GFP was used as a control (A). GFP was fused in-frame to the C terminus of the full open reading frame of AtsPLA2β (B) or to the C terminus of the signal peptide sequence of AtsPLA2β (C). The top row depicts vector fusion constructs, the middle row depicts the onion cell structure observed by light microscopy, and the bottom row depicts the cytolocalization of GFP and GFP fusion proteins observed by fluorescence microscopy.
Figure 6.
Figure 6.
Gravitropic Responses of the Inflorescence Stems, Hypocotyls, and Roots of Transgenic Arabidopsis Plants (Col-0) That Overexpress AtsPLA2β or Silence AtsPLA2β Expression as a Result of RNAi Compared with Wild-Type Plants. (A) and (B) Relative RT-PCR and PLA2 activity in the inflorescence stems of three 5-week-old independent T3 transgenic Arabidopsis lines that overexpress AtsPLA2β (A) and in the leaf tissues of three 2-week-old independent T3 transgenic Arabidopsis lines that suppress AtsPLA2β expression as a result of RNAi (B). Thirty-five and 20 cycles of RT-PCR were used to amplify AtsPLA2β and 18S rRNA fragments, respectively. WT, wild type. (C) to (F) Gravitropic responses of the inflorescence stems of 5-week-old wild-type plants (C) and three independent T3 transgenic lines overexpressing AtsPLA2β ([D] to [F]) after 60 min of horizontal gravistimulation. (G) to (L) Gravitropic responses of the hypocotyls and roots of 3-day-old dark-grown wild-type plants (G), two independent T3 transgenic lines that overexpress AtsPLA2β ([H] and [I]), and three independent T3 transgenic lines that suppress AtsPLA2β expression as a result of RNAi ([J] to [L]) after 26 h of horizontal gravistimulation.
Figure 7.
Figure 7.
Time Course of the Gravitropic Response of the Inflorescence Stems of Wild-Type and Transgenic Arabidopsis Plants, and Gravitropic Response–Specific Activation of the AtsPLA2β Promoter in the Curving Regions of Inflorescence Stems. (A) Data for wild-type (WT) plants (Col-0; open circles) and AtsPLA2β-overexpressing transgenic plants (T3 1-1 line; closed circles). Approximately 30 individual inflorescence stems were examined in each of four independent experiments. The vertical error bars represent se values. (B) Histochemical staining in the inflorescence stems of transgenic Arabidopsis (Col-0) carrying the AtsPLA2β promoter–GUS construct at different stages of the gravitropic response. A control stem without gravistimulation (left) and stems with curvatures of 80° (middle) and 125° (right) are shown. The curving regions of the stems with strong GUS activity are indicated with arrows.
Figure 8.
Figure 8.
Comparison of the Growth of Inflorescence Stems and Leaf Petioles in Wild-Type and Transgenic Arabidopsis Plants. Twenty-five-day-old Arabidopsis plants (A) and leaf petioles (B), and light micrographs of the cortical cells in longitudinal sections of leaf petioles (C). Wild-type Col-0 (left), AtsPLA2β-overexpressing T3 transgenic line 1-1 (middle), and AtsPLA2β-silenced T3 transgenic line C-5 (right) are shown. Bars = 100 μm.
Figure 9.
Figure 9.
Time Course of Longitudinal Growth in the Inflorescence Stems of Wild-Type and Transgenic Arabidopsis Plants. Data for wild-type (WT) plants (Col-0; open circles), AtsPLA2β-overexpressing transgenic plants (T3 1-1 line; closed circles), and AtsPLA2β-silenced plants (T3 C-5 line; closed triangles). The vertical error bars represent sd values (n = 20).

Similar articles

Cited by

References

    1. Bechtold, N., and Pelletier, G. (1998). In planta Agrobacterium-mediated transformation of adult Arabidopsis thaliana plants by vacuum infiltration. Methods Mol. Biol. 82, 259–266. - PubMed
    1. Boonsirichai, K., Guan, C., Chen, R., and Masson, P.H. (2002). Root gravitropism: An experimental tool to investigate basic cellular and molecular processes underlying mechanosensing and signal transmission in plants. Annu. Rev. Plant Biol. 53, 421–447. - PubMed
    1. Brightman, A.O., Zhu, X.Z., and Morrè, D.J. (1991). Activation of plasma membrane NADH oxidase activity by products of phospholipase A. Plant Physiol. 96, 1314–1320. - PMC - PubMed
    1. Chapman, K.D. (1998). Phospholipase activity during plant growth and development and in response to environmental stress. Trends Plant Sci. 3, 419–426.
    1. Clough, S.J., and Bent, A.F. (1998). Floral dip: A simplified method for Agrobacterium-mediated transformation of Arabidopsis thaliana. Plant J. 16, 735–743. - PubMed

Publication types

MeSH terms

Associated data