

Transcript profiling coupled with spatial expression analyses reveals genes involved in distinct developmental stages of an arbuscular mycorrhizal symbiosis
- PMID: 12953114
- PMCID: PMC181334
- DOI: 10.1105/tpc.014183
Transcript profiling coupled with spatial expression analyses reveals genes involved in distinct developmental stages of an arbuscular mycorrhizal symbiosis
Abstract
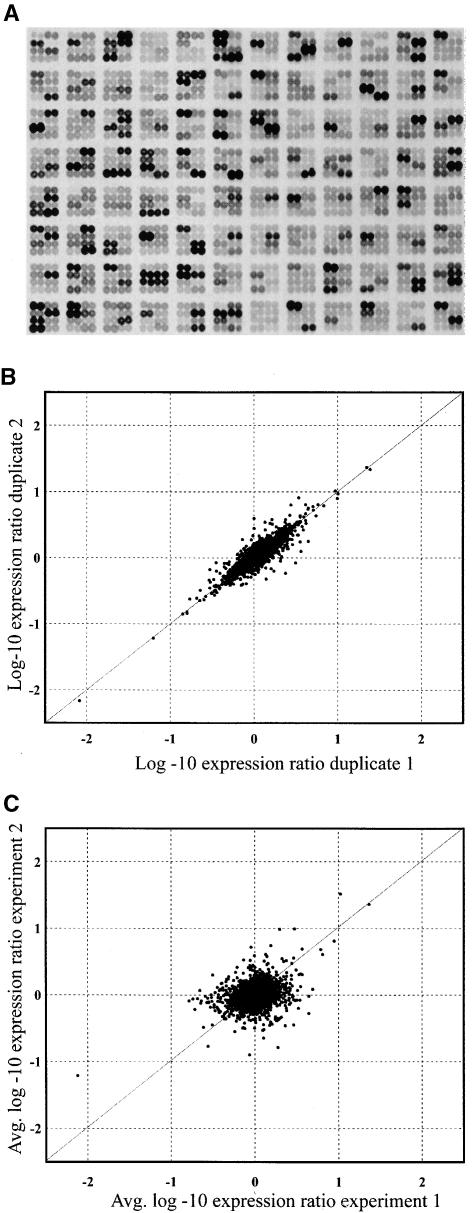
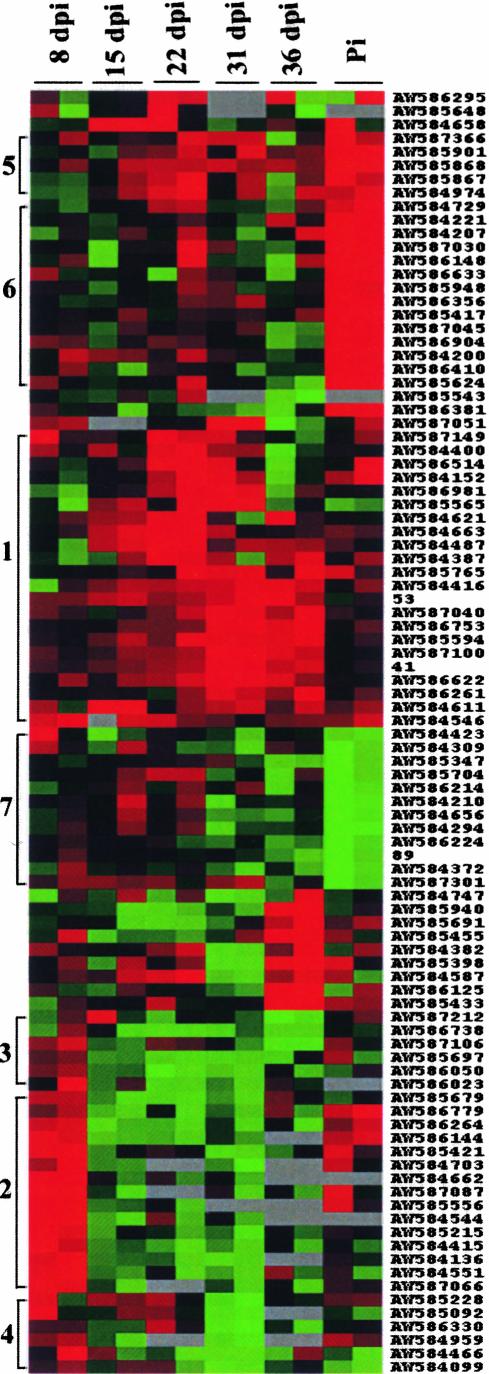
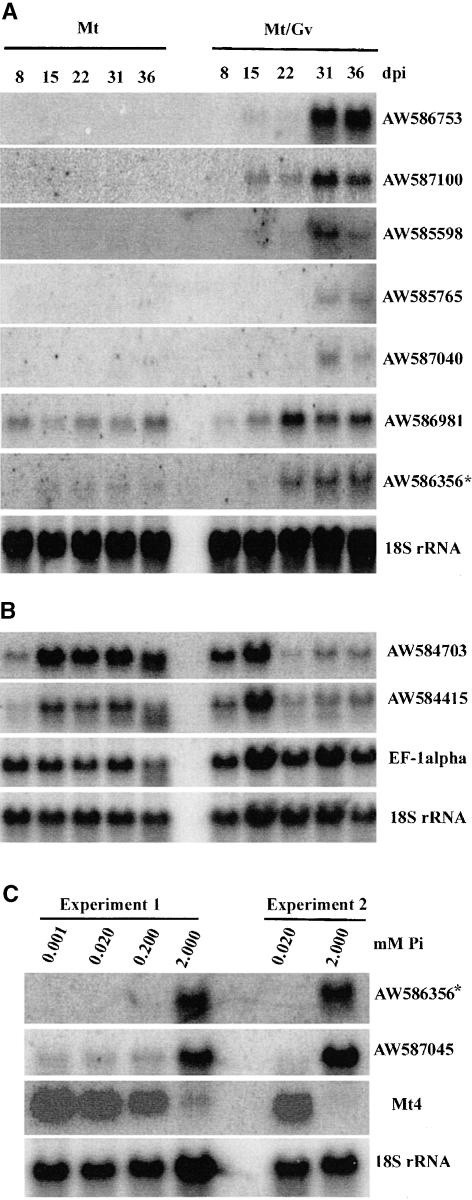
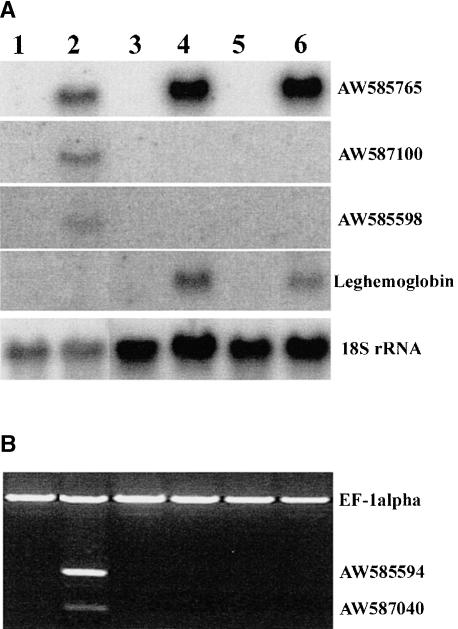
The formation of symbiotic associations with arbuscular mycorrhizal (AM) fungi is a phenomenon common to the majority of vascular flowering plants. Here, we used cDNA arrays to examine transcript profiles in Medicago truncatula roots during the development of an AM symbiosis with Glomus versiforme and during growth under differing phosphorus nutrient regimes. Three percent of the genes examined showed significant changes in transcript levels during the development of the symbiosis. Most genes showing increased transcript levels in mycorrhizal roots showed no changes in response to high phosphorus, suggesting that alterations in transcript levels during symbiosis were a consequence of the AM fungus rather than a secondary effect of improved phosphorus nutrition. Among the mycorrhiza-induced genes, two distinct temporal expression patterns were evident. Members of one group showed an increase in transcripts during the initial period of contact between the symbionts and a subsequent decrease as the symbiosis developed. Defense- and stress-response genes were a significant component of this group. Genes in the second group showed a sustained increase in transcript levels that correlated with the colonization of the root system. The latter group contained a significant proportion of new genes similar to components of signal transduction pathways, suggesting that novel signaling pathways are activated during the development of the symbiosis. Analysis of the spatial expression patterns of two mycorrhiza-induced genes revealed distinct expression patterns consistent with the hypothesis that gene expression in mycorrhizal roots is signaled by both cell-autonomous and cell-nonautonomous signals.
Figures
Similar articles
-
Construction and validation of cDNA-based Mt6k-RIT macro- and microarrays to explore root endosymbioses in the model legume Medicago truncatula.J Biotechnol. 2004 Mar 4;108(2):95-113. doi: 10.1016/j.jbiotec.2003.11.011. J Biotechnol. 2004. PMID: 15129719
-
Medicago truncatula and Glomus intraradices gene expression in cortical cells harboring arbuscules in the arbuscular mycorrhizal symbiosis.BMC Plant Biol. 2009 Jan 22;9:10. doi: 10.1186/1471-2229-9-10. BMC Plant Biol. 2009. PMID: 19161626 Free PMC article.
-
A roadmap of cell-type specific gene expression during sequential stages of the arbuscular mycorrhiza symbiosis.BMC Genomics. 2013 May 7;14:306. doi: 10.1186/1471-2164-14-306. BMC Genomics. 2013. PMID: 23647797 Free PMC article.
-
Signaling in the arbuscular mycorrhizal symbiosis.Annu Rev Microbiol. 2005;59:19-42. doi: 10.1146/annurev.micro.58.030603.123749. Annu Rev Microbiol. 2005. PMID: 16153162 Review.
-
Development of bioinformatic tools to support EST-sequencing, in silico- and microarray-based transcriptome profiling in mycorrhizal symbioses.Phytochemistry. 2007 Jan;68(1):19-32. doi: 10.1016/j.phytochem.2006.09.026. Epub 2006 Nov 1. Phytochemistry. 2007. PMID: 17081576 Review.
Cited by
-
Analyzing the soybean transcriptome during autoregulation of mycorrhization identifies the transcription factors GmNF-YA1a/b as positive regulators of arbuscular mycorrhization.Genome Biol. 2013 Jun 18;14(6):R62. doi: 10.1186/gb-2013-14-6-r62. Genome Biol. 2013. PMID: 23777981 Free PMC article.
-
Organization and metabolism of plastids and mitochondria in arbuscular mycorrhizal roots of Medicago truncatula.Plant Physiol. 2005 Sep;139(1):329-40. doi: 10.1104/pp.105.061457. Epub 2005 Aug 26. Plant Physiol. 2005. PMID: 16126866 Free PMC article.
-
Genomic and genetic control of phosphate stress in legumes.Plant Physiol. 2007 Jun;144(2):594-603. doi: 10.1104/pp.107.097386. Plant Physiol. 2007. PMID: 17556523 Free PMC article. Review. No abstract available.
-
The role of the cell wall compartment in mutualistic symbioses of plants.Front Plant Sci. 2014 Jun 2;5:238. doi: 10.3389/fpls.2014.00238. eCollection 2014. Front Plant Sci. 2014. PMID: 24917869 Free PMC article. Review.
-
Transcriptional responses of Medicago truncatula upon sulfur deficiency stress and arbuscular mycorrhizal symbiosis.Front Plant Sci. 2014 Dec 2;5:680. doi: 10.3389/fpls.2014.00680. eCollection 2014. Front Plant Sci. 2014. PMID: 25520732 Free PMC article.
References
-
- Akiyama, K., Matuoka, H., and Hayashi, H. (2002). Isolation and identification of a phosphate deficiency-induced C-glycosylflavonoid that stimulates arbuscular mycorrhiza formation in melon roots. Mol. Plant-Microbe Interact. 15, 334–340. - PubMed
-
- Alexander, T., Meier, R., Toth, R., and Weber, H.C. (1988). Dynamics of arbuscule development and degeneration in mycorrhizas of Triticum aestivum L. and Avena sativa L. with reference to Zea mays L. New Phytol. 110, 363–370.
-
- Alexander, T., Toth, R., Meier, R., and Weber, H.C. (1989). Dynamics of arbuscule development and degeneration in onion, bean and tomato with reference to vesicular-arbuscular mycorrhizae in grasses. Can. J. Bot. 67, 2505–2513.
-
- Ames, B.N. (1966). Assay of inorganic phosphate, total phosphate and phosphatases. Methods Enzymol. 8, 115–118.
Publication types
MeSH terms
Substances
Associated data
- Actions
- Actions
- Actions
- Actions
- Actions
LinkOut - more resources
Full Text Sources
Molecular Biology Databases
