Comparative Study
. 2003 Sep 15;31(18):5338-48.
doi: 10.1093/nar/gkg745.

Patterns of nucleotide substitution, insertion and deletion in the human genome inferred from pseudogenes

Affiliations
Comparative Study

Patterns of nucleotide substitution, insertion and deletion in the human genome inferred from pseudogenes

Zhaolei Zhang et al. Nucleic Acids Res. .

Abstract

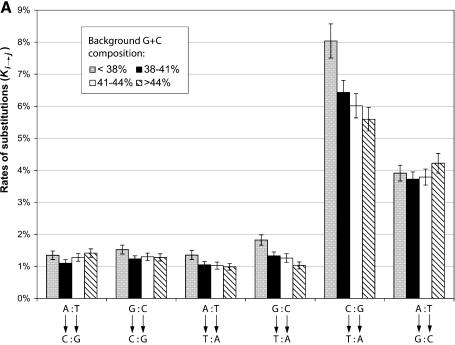
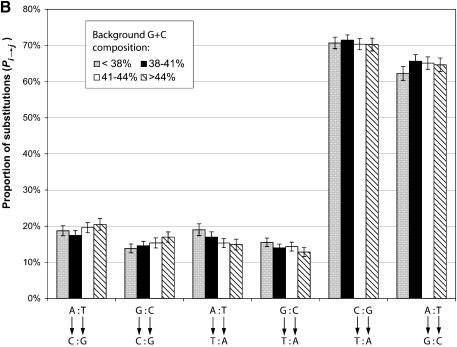
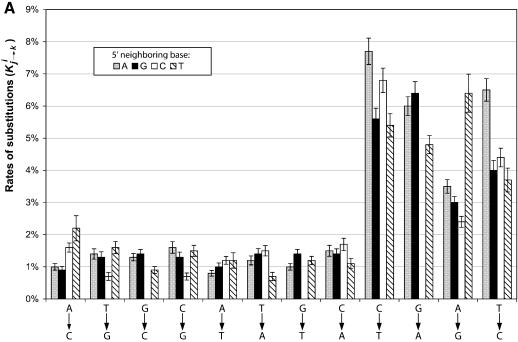
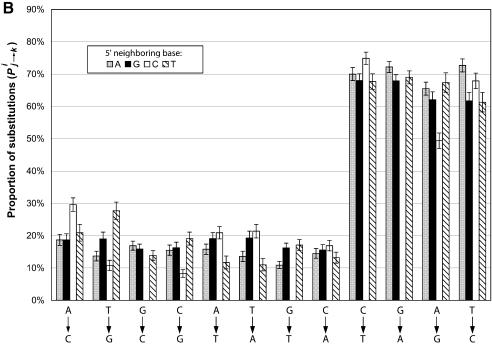
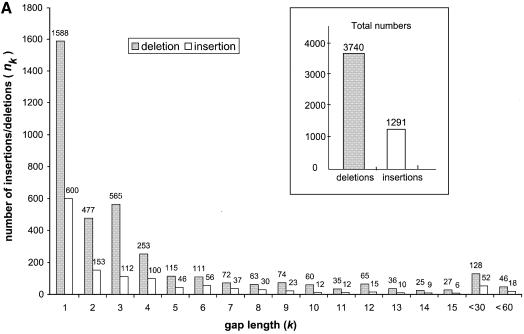
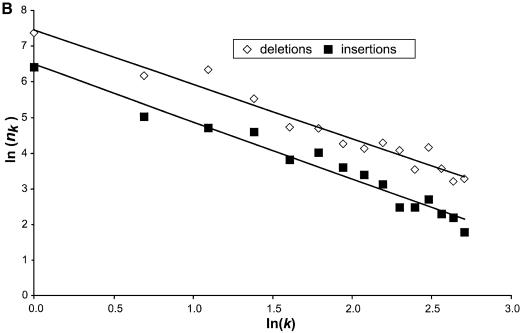
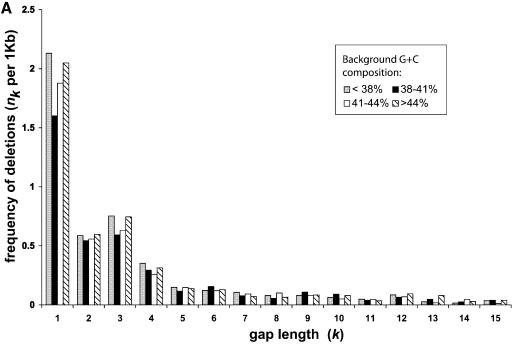
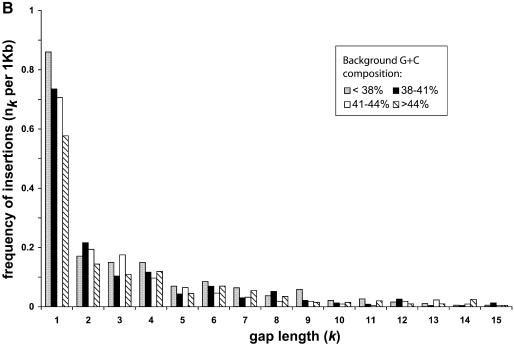
Nucleotide substitution, insertion and deletion (indel) events are the major driving forces that have shaped genomes. Using the recently identified human ribosomal protein (RP) pseudogene sequences, we have thoroughly studied DNA mutation patterns in the human genome. We analyzed a total of 1726 processed RP pseudogene sequences, comprising more than 700 000 bases. To be sure to differentiate the sequence changes occurring in the functional genes during evolution from those occurring in pseudogenes after they were fixed in the genome, we used only pseudogene sequences originating from parts of RP genes that are identical in human and mouse. Overall, we found that nucleotide transitions are more common than transversions, by roughly a factor of two. Moreover, the substitution rates amongst the 12 possible nucleotide pairs are not homogeneous as they are affected by the type of immediately neighboring nucleotides and the overall local G+C content. Finally, our dataset is large enough that it has many indels, thus allowing for the first time statistically robust analysis of these events. Overall, we found that deletions are about three times more common than insertions (3740 versus 1291). The frequencies of both these events follow characteristic power-law behavior associated with the size of the indel. However, unexpectedly, the frequency of 3 bp deletions (in contrast to 3 bp insertions) violates this trend, being considerably higher than that of 2 bp deletions. The possible biological implications of such a 3 bp bias are discussed.


Figures

Figure 1
Figure 1
Substitution pattern between nucleotide pairs. Pseudogenes are grouped by their background G+C composition. (A) Substitution rates as normalized by the numbers of nucleotides of each type. Each column represents the proportion of nucleotides that have mutated to another type. Confidence intervals (95%) are also given. (B) The proportion of substitutions as normalized by the numbers of mutations that have occurred to each type. Each column represents, among total number of mutated nucleotides, the proportion of mutations from one type to another.
Figure 1
Figure 1
Substitution pattern between nucleotide pairs. Pseudogenes are grouped by their background G+C composition. (A) Substitution rates as normalized by the numbers of nucleotides of each type. Each column represents the proportion of nucleotides that have mutated to another type. Confidence intervals (95%) are also given. (B) The proportion of substitutions as normalized by the numbers of mutations that have occurred to each type. Each column represents, among total number of mutated nucleotides, the proportion of mutations from one type to another.
Figure 2
Figure 2
Neighboring effects on the nucleotide substitution patterns. Di-nucleotides are grouped on the basis of their first (5′) nucleotide. (A) Substitution rates as normalized by the numbers of nucleotides of each type. Each column represents, given that the first nucleotide is unchanged, the chance that the second nucleotide has mutated to another type in the pseudogenes. Substitutions that have the same type of 5′ adjacent nucleotide have the same shading. (B) Proportion of substitutions as normalized by the total numbers of mutations that have occurred to the 3′ nucleotide. Each column represents, given that a mutation has occurred to the second nucleotide in the original di-nucleotide, the chance that it mutated to each one of the three other types.
Figure 2
Figure 2
Neighboring effects on the nucleotide substitution patterns. Di-nucleotides are grouped on the basis of their first (5′) nucleotide. (A) Substitution rates as normalized by the numbers of nucleotides of each type. Each column represents, given that the first nucleotide is unchanged, the chance that the second nucleotide has mutated to another type in the pseudogenes. Substitutions that have the same type of 5′ adjacent nucleotide have the same shading. (B) Proportion of substitutions as normalized by the total numbers of mutations that have occurred to the 3′ nucleotide. Each column represents, given that a mutation has occurred to the second nucleotide in the original di-nucleotide, the chance that it mutated to each one of the three other types.
Figure 3
Figure 3
(A) The length distribution of insertions and deletions in the pseudogenes. Only deletions and insertions of <60 bp are shown. The total number of insertions and deletions are shown in the inset. (B) Plots of k and nk on log scale. Deletions are shown as closed squares and insertions as open diamonds. Trend lines are fitted to the two series as well.
Figure 3
Figure 3
(A) The length distribution of insertions and deletions in the pseudogenes. Only deletions and insertions of <60 bp are shown. The total number of insertions and deletions are shown in the inset. (B) Plots of k and nk on log scale. Deletions are shown as closed squares and insertions as open diamonds. Trend lines are fitted to the two series as well.
Figure 4
Figure 4
The length distribution of deletions (A) and insertions (B) in the genomic regions of different G+C composition.
Figure 4
Figure 4
The length distribution of deletions (A) and insertions (B) in the genomic regions of different G+C composition.

References

    1. Mighell A.J., Smith,N.R., Robinson,P.A. and Markham,A.F. (2000) Vertebrate pseudogenes. FEBS Lett., 468, 109–114. - PubMed
    1. Esnault C., Maestre,J. and Heidmann,T. (2000) Human line retrotransposons generate processed pseudogenes. Nature Genet., 24, 363–367. - PubMed
    1. Antonarakis S.E., Krawczak,M. and Cooper,D.N. (2000) Disease-causing mutations in the human genome. Eur. J. Pediatr., 159, S173–S178. - PubMed
    1. Krawczak M., Chuzhanova,N.A., Stenson,P.D., Johansen,B.N., Ball,E.V. and Cooper,D.N. (2000) Changes in primary DNA sequence complexity influence the phenotypic consequences of mutations in human gene regulatory regions. Hum. Genet., 107, 362–365. - PubMed
    1. Hess S.T., Blake,J.D. and Blake,R.D. (1994) Wide variations in neighbor-dependent substitution rates. J. Mol. Biol., 236, 1022–1033. - PubMed

Publication types

Substances