. 2003 Sep 3;23(22):7993-8001.
doi: 10.1523/JNEUROSCI.23-22-07993.2003.

Ketamine-xylazine-induced slow (< 1.5 Hz) oscillations in the rat piriform (olfactory) cortex are functionally correlated with respiration

Affiliations

Ketamine-xylazine-induced slow (< 1.5 Hz) oscillations in the rat piriform (olfactory) cortex are functionally correlated with respiration

Alfredo Fontanini et al. J Neurosci. .

Abstract

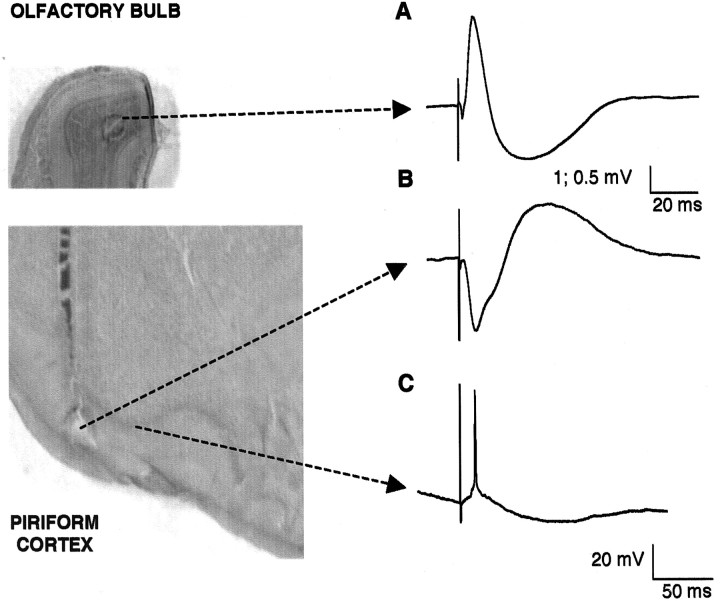
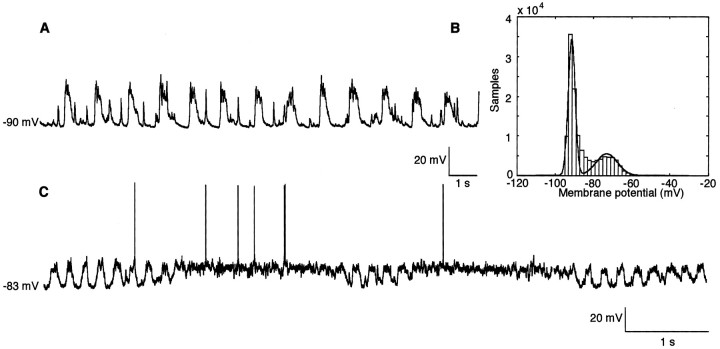
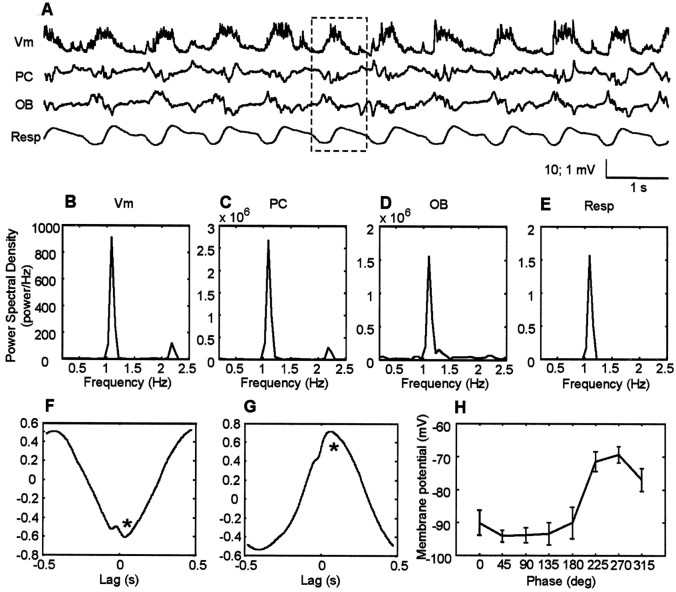
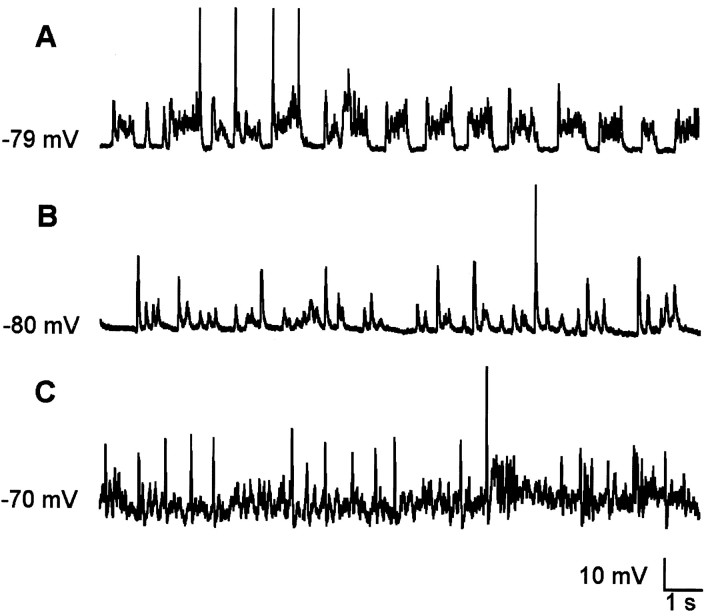
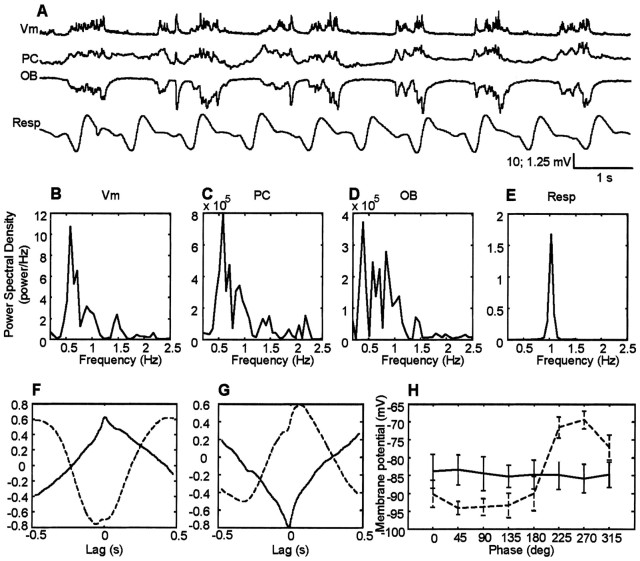
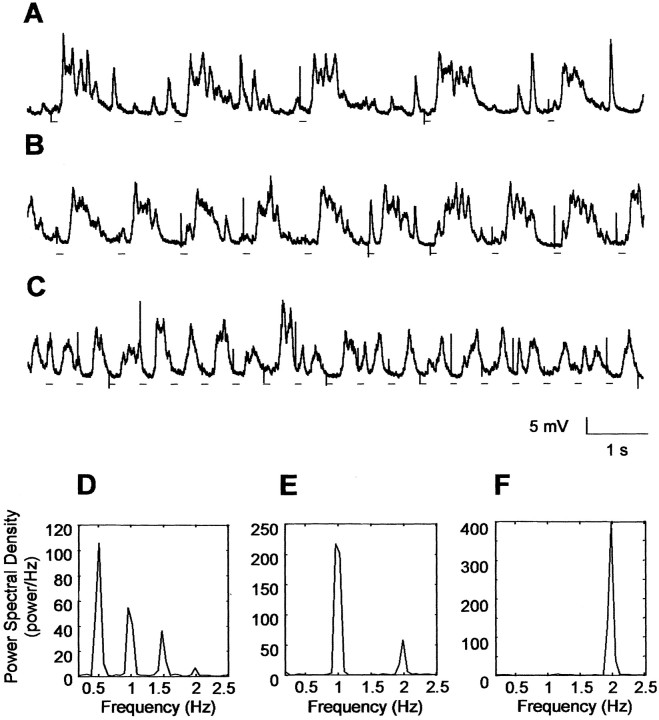
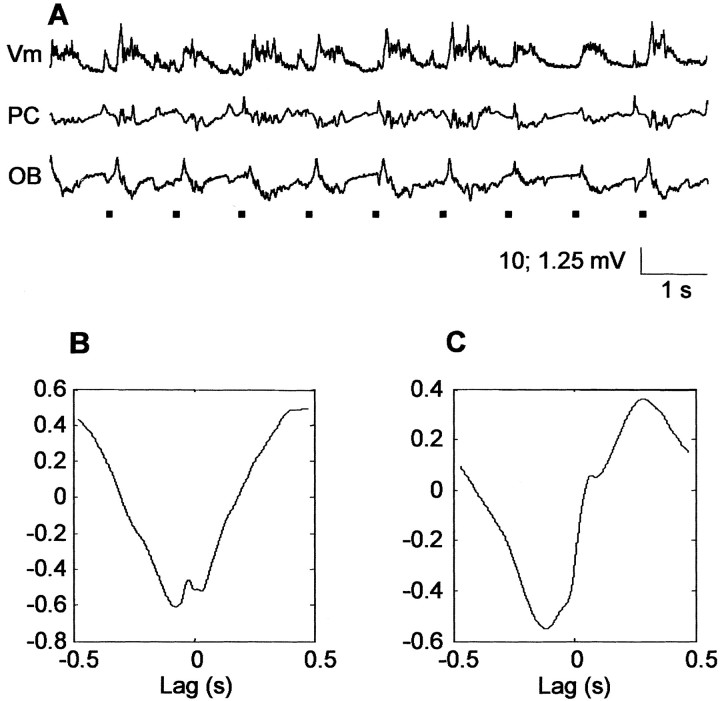
The occurrence of low frequency (<1.5 Hz) cerebral cortical oscillations during slow-wave sleep has recently lead to the suggestion that this pattern of activity is specifically associated with conditions in which the brain is mostly closed to external inputs and running on its own. In the current experiments, we used a combination of in vivo intracellular and extracellular field potential recordings obtained under conditions of ketamine-xylazine anesthesia to examine slow-wave behavior in the olfactory system. We demonstrate the occurrence of low-frequency oscillations in field potentials of both the olfactory bulb and cortex and in the membrane potentials of cortical pyramidal cells. By monitoring ongoing breathing, we also show that these oscillations are all correlated with the natural breathing cycle. Using a tracheotomized preparation, we demonstrate that slow oscillatory patterns could occasionally be produced even when air is no longer entering the nose, supporting the view that the olfactory system has an intrinsic propensity to oscillate. However, in the case of tracheotomized rats, the amplitude and regularity of the oscillations as well as their patterns of correlation are disrupted. All temporal relationships were restored when air was pulsed into the nostrils. We conclude that, in the olfactory system of freely breathing rats, there is a strong relationship between the occurrence and timing of slow oscillations and the ongoing periodic sensory input resulting from respiration. This coupling between olfactory cortex slow oscillations and respiration may result from the interaction between respiratory-related rhythmic input and the tendency for olfactory structures to oscillate intrinsically. We believe this finding has important functional as well as evolutionary implications.


Figures

Figure 1.
Figure 1.
Positioning of electrodes: characteristic response to LOT strong electrical shock. A, Extracellular recording from the granule cell layer of the olfactory bulb. B, Extracellular recording from layer I of the piriform cortex showing the monosynaptic and disynaptic (associative) components characteristic of that layer. C, Characteristic intracellular response of a layer II/III pyramidal neuron to LOT stimulation with an EPSP or spike followed by a prolonged hyperpolarization. Calibration: 1 and 0.5 mV, 20 msec (from olfactory bulb and piriform cortex, respectively); 20 mV, 50 msec for intracellular recordings. Left, Histological assessment of extracellular electrode positioning. Note that lesions in the granule cell layer of the olfactory bulb (top) and in layer I of the piriform cortex (bottom) are shown. Arrows connect areas in which recordings were performed to their characteristic response.
Figure 2.
Figure 2.
Characteristic ongoing membrane potential fluctuations in layer II/III pyramidal cells. A, Membrane potential recording from a representative neuron; the spiky events occurring in the down states are PSP spontaneously generated. B, Bimodal distribution of the histogram of membrane potential in a slowly oscillating cell: fitting with a sum of two Gaussians (continuous line). C, An example of less frequently seen behavior in which ongoing slow-wave oscillations were occasionally interrupted by periods of sustained membrane depolarization and accompanying action potential generation.
Figure 3.
Figure 3.
Comparisons of cortical, bulbar, and respiratory oscillations. A, Representative raw traces of pyramidal cell membrane potential (Vm), local field potentials in layer I of PC, in the granule cell layer of the OB and respiratory wave as recorded from chest wall movements (Resp). In the respiratory wave, the downward deflection represents the inspiration. All traces were recorded simultaneously. The dotted line highlights a single hyperpolarization-depolarization cycle. The vertical scale for the intracellular records is 10 mV, whereas the extracellular records are 1 mV. The graphs B--E indicate the power spectral density for the recorded membrane potentials (B), local field potentials recorded in the piriform cortex (C), in the olfactory bulb (D), and ongoing respiration (E). F, Representative cross-covariance between membrane potential of a layer II/III pyramidal cell and layer I olfactory cortex local field potentials. Note that the negative peak (asterisk) at a time close to 0 sec is shown; such a negative peak reflects the anticorrelation existing between membrane potential and local field potentials in layer I of the piriform cortex. G, Representative cross-covariance between membrane potential and local field potentials in the granule cell layer of the olfactory bulb. In this case, the peak near time 0 is positive, consistent with the positive correlation between membrane potential and field potentials in the olfactory bulb. H, Respiratory wave-triggered average of membrane potential; 0° phase represents the beginning of the inspiration.
Figure 4.
Figure 4.
Patterns of intracellular activity in tracheotomized rats. A, Slow oscillations in absence of rhythmic respiratory input. B, Hyperpolarized membrane potential with large synaptic potentials. C, Depolarized membrane potential with high-frequency, low-amplitude oscillations.
Figure 5.
Figure 5.
Comparisons of cortical, bulbar, and respiratory oscillations in tracheotomized rats. A, Raw traces of pyramidal cell membrane potential (Vm), local field potentials in layer I of PC, in the granule cell layer of the OB, and respiratory wave (Resp). In the respiratory wave, the downward deflection represents the inspiration. As in Figure 3, the graphs B-E indicate the power spectral density for the recorded membrane potentials (B), local field potentials recorded in piriform cortex (C), olfactory bulb (D), and ongoing respiration (E). F, Cross-covariance between membrane potential (Vm) of a layer II/III pyramidal cell and layer I olfactory cortex local field potentials. G, Cross-covariance between Vm and local field potentials in the granule cell layer of the olfactory bulb. H, Respiratory wave-triggered average of membrane potential. As in Figure 3H, the 0° phase represents the beginning of the inspiration. Dashed line, Intact preparation; continuous line, tracheotomized preparation.
Figure 6.
Figure 6.
Air forced in the nostrils produces slow membrane potential fluctuations. Air pulses (black lines under traces) of 100 msec duration and 45 psi intensity were forced into the nostrils of the rat at different frequencies [∼0.5 Hz (A), ∼1 Hz (B), ∼2 Hz (C)] when the rat was deeply anesthetized. The spiky depolarizations observed are electrical artifacts synchronized with the beginning of the air puff. D, E, and F show the peak in the power spectrum corresponding to the frequencies of air-induced oscillations.
Figure 7.
Figure 7.
Effects of air forced in the nostrils on cross-covariance patterns. Air forced in the nostrils produces activity and cross-covariance patterns similar to those present in deeply anesthetized, freely breathing rats. A, Air puff-induced oscillations: Vm, membrane potential; PC piriform cortex local field potentials; OB, olfactory bulb local field potentials. Black lines represent the timing of the occurrence of air puffs. B, Representative cross-covariance between membrane potential and piriform cortex local field potentials. C, Representative cross-covariance between membrane potential and olfactory bulb local field potentials.

Similar articles

Cited by

References

    1. Achermann P, Borbély AA ( 1997) Low-frequency (<1 Hz) oscillations in the human sleep electroencephalogram. Neuroscience 81: 213-222. - PubMed
    1. Adrian ED ( 1942) Olfactory reactions in the brain of the hedgehog. J Physiol (Lond) 100: 459-473. - PMC - PubMed
    1. Amzica F, Steriade M ( 1997) The K-complex: its slow (<1-Hz) rhythmicity and relation to delta waves. Neurology 49: 952-959. - PubMed
    1. Bazhenov M, Timofeev I, Steriade M, Sejnowski TJ ( 2002) Model of thalamocortical slow-wave sleep oscillations and transitions to activated states. J Neurosci 22: 8691-8704. - PMC - PubMed
    1. Bhalla US, Bower JM ( 1997) Multiday recordings from olfactory bulb neurons in awake freely moving rats: spatially and temporally organized variability in odorant response properties. J Comput Neurosci 4: 221-256. - PubMed

Publication types

MeSH terms

LinkOut - more resources