. 2003 Sep 30;100(20):11541-6.
doi: 10.1073/pnas.1831119100. Epub 2003 Sep 3.

Maize-targeted mutagenesis: A knockout resource for maize

Affiliations

Maize-targeted mutagenesis: A knockout resource for maize

Bruce P May et al. Proc Natl Acad Sci U S A. .

Abstract

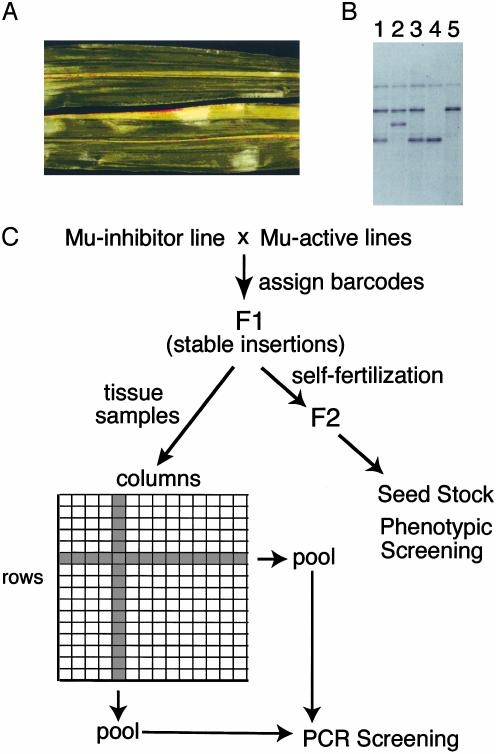
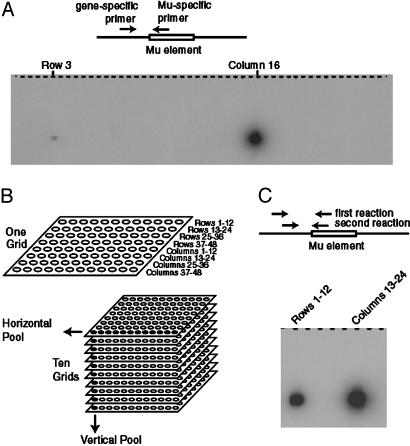
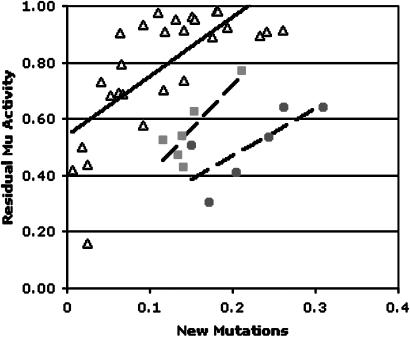
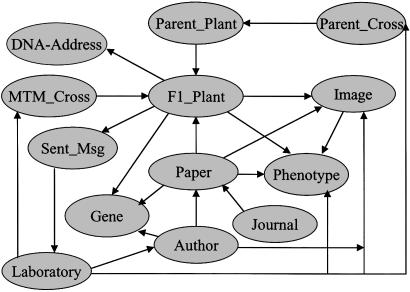
We describe an efficient system for site-selected transposon mutagenesis in maize. A total of 43,776 F1 plants were generated by using Robertson's Mutator (Mu) pollen parents and self-pollinated to establish a library of transposon-mutagenized seed. The frequency of new seed mutants was between 10-4 and 10-5 per F1 plant. As a service to the maize community, maize-targeted mutagenesis selects insertions in genes of interest from this library by using the PCR. Pedigree, knockout, sequence, phenotype, and other information is stored in a powerful interactive database (maize-targeted mutagenesis database) that enables analysis of the entire population and the handling of knockout requests. By inhibiting Mu activity in most F1 plants, we sought to reduce somatic insertions that may cause false positives selected from pooled tissue. By monitoring the remaining Mu activity in the F2, however, we demonstrate that seed phenotypes depend on it, and false positives occur in lines that appear to lack it. We conclude that more than half of all mutations arising in this population are suppressed on losing Mu activity. These results have implications for epigenetic models of inbreeding and for functional genomics.


Figures

Fig. 1.
Fig. 1.
Scheme for selecting germinal insertions of Mu insertions. (A) Somatic transposition of Mu elements results in clonal pale green sectors of homozygous mutant tissue in hcf106/+ heterozygous plants. (B) Genomic DNA was prepared from the pale green sector shown in A (lane 2), normal tissue on either side (lanes 1 and 3), homozygous normal (lane 4), and homozygous mutant (lane 5) plants. DNA was digested with HindIII before DNA gel blot analysis using the hcf106 gene as a probe. Note the insertion of Mu DNA into the lower, WT allele. (C) Pooling scheme to identify germinal insertions. To avoid detecting somatic insertions such as those in A, Mu-active lines were first crossed to a Mu-inhibitor strain to inactivate Mu. Germinal insertions were then detected in the F1 plants. An upper leaf from each plant was deribbed, and opposite halves were used for row and column pools. Because clonal sectors have not been observed to cross the midvein (A), somatic insertions should not appear in row and column pools.
Fig. 2.
Fig. 2.
Screening for Mu insertions in Vp1. (A) Simple PCR between a gene-specific primer and a Mu-specific primer. The products were blotted and probed with a fragment of Vp1 generated by primers vp1–114 and vp1–615. Autoradiography was 16 h. Only 48 of the 96 reactions required to screen a grid are shown. (B) Pooling strategy to reduce the number of reactions required to screen the collection. Groups of 12 rows or columns were pooled horizontally across a grid; grid positions were pooled vertically across grids. (C) Detection of the Vp1 insertion in the horizontally pooled pools. Reaction products were blotted and probed as above, except autoradiography was 2 h.
Fig. 3.
Fig. 3.
Distribution of Mu insertions in 72 genes among 43,776 F1 plants. The insertions were detected by nested PCRs on DNA pools from F1 leaf tissue, and transmission to the F2 was confirmed in all cases by similar PCR analysis on DNA from 1-week-old seedlings.
Fig. 4.
Fig. 4.
Mu dependence of newly arising kernel phenotypes. Each point represents data from a single F1 family, and associated linear regression trend lines are shown. ▴, 1998b population; ▪, six families derived from a single parent, 1998a population; •, six families derived from a single parent, 1998a population.
Fig. 5.
Fig. 5.
Schema of the mtmDB. Classes of data objects are shown as ellipses, and their interrelationships are represented as arrows.

References

    1. Martienssen, R. A. (1998) Proc. Natl. Acad. Sci. USA 95, 2021–2026. - PMC - PubMed
    1. Lee, K. Y., Lund, P., Lowe, K. & Dunsmuir, P. (1990) Plant Cell 2, 415–425. - PMC - PubMed
    1. Miao, Z. H. & Lam, E. (1995) Plant J 7, 359–365. - PubMed
    1. Kaiser, K. & Goodwin, S. F. (1990) Proc. Natl. Acad. Sci. USA 87, 1686–1690. - PMC - PubMed
    1. Zwaal, R. R., Broeks, A., van Meurs, J., Groenen, J. T. & Plasterk, R. H. (1993) Proc. Natl. Acad. Sci. USA 90, 7431–7435. - PMC - PubMed

Publication types