Comparative Study
. 2003 Aug 25:1:11.
doi: 10.1186/1476-7120-1-11.

Strain and strain rate parametric imaging. A new method for post processing to 3-/4-dimensional images from three standard apical planes. Preliminary data on feasibility, artefact and regional dyssynergy visualisation

Affiliations
Comparative Study

Strain and strain rate parametric imaging. A new method for post processing to 3-/4-dimensional images from three standard apical planes. Preliminary data on feasibility, artefact and regional dyssynergy visualisation

Asbjørn Støylen et al. Cardiovasc Ultrasound. .

Abstract

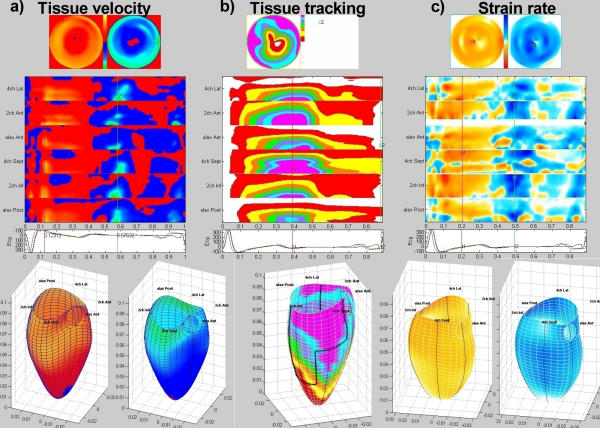
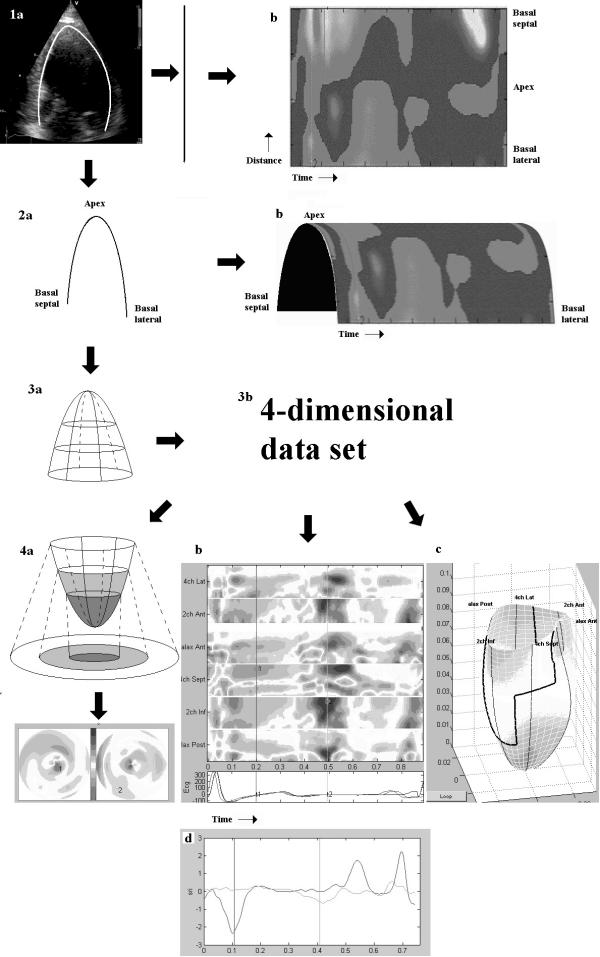
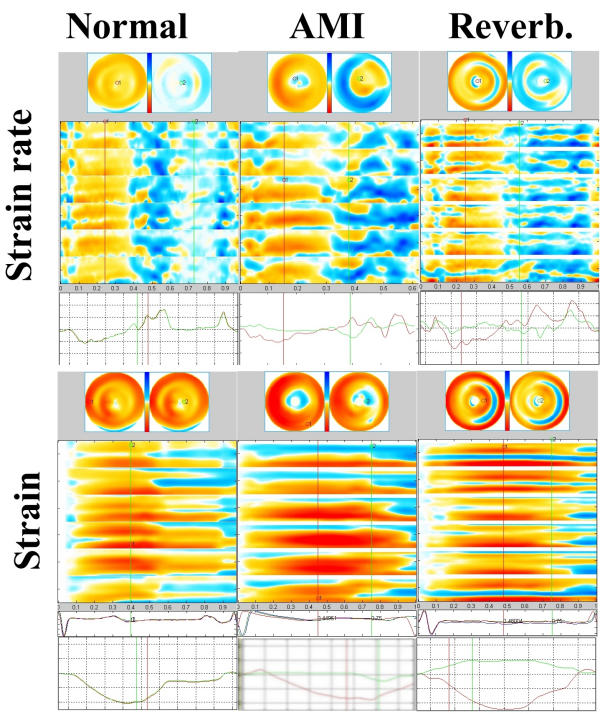
Background: We describe a method for 3-/4D reconstruction of tissue Doppler data from three standard apical planes, post processing to derived data of strain rate/strain and parametric colour imaging of the data. The data can be displayed as M-mode arrays from all six walls, Bull's eye projection and a 3D surface figure that can be scrolled and rotated. Numerical data and waveforms can be re-extracted.

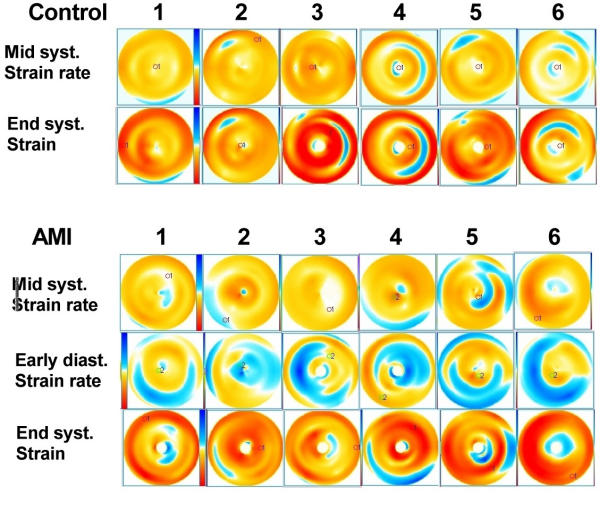
Methods: Feasibility was tested by Strain Rate Imaging in 6 normal subjects and 6 patients with acute myocardial infarction. Reverberation artefacts and dyssynergy was identified by colour images. End systolic strain, peak systolic and mid systolic strain rate were measured.

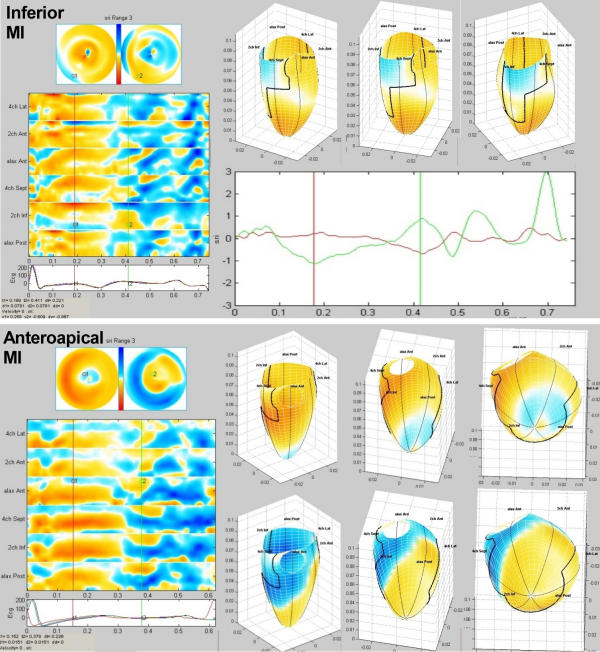
Results: Infarcts were visualised in all patients by colour imaging of mid systolic strain rate, end systolic strain and post systolic shortening by strain rate. Reverberation artefacts were visible in 3 of 6 normals, and 2 of 6 patients, and were identified both on bull's eye and M-mode display, but influenced quantitative measurement. Peak systolic strain rate was in controls minimum -1.11, maximum -0.89 and in patients minimum -1.66, maximum 0.02 (p = 0.04). Mid systolic strain rate and end systolic strain did not separate the groups significantly.

Conclusion: 3-/4D reconstruction and colour display is feasible, allowing quick visual identification of infarcts and artefacts, as well as extension of area of post systolic shortening. Strain rate is better suited to colour parametric display than strain.


Figures

Figure 1
Figure 1
Different parametric imaging in 3-/4D display, all from a normal subject. Left to right: The red-blue display of tissue velocity, the coloured bands of tissue tracking and the yellow-blue display of strain rate. In tissue velocity, lighter colour represents higher velocities, showing clearly the velocity gradient from base to apex both in systole and diastole. In tissue tracking, each colour represents an interval of 2 mm displacement, as shown by the legend. This means that red represents 2 – 4 mm displacement, increasing to magenta showing >14 mm at the base. Strain rate shows shortening in yellow to red, lengthening in blue, darker colour represents more deformation. Some inhomogeneity is visible due to noise and dropouts. Top to bottom: Bull's eye display both in systole and diastole (except tissue tracking), M-mode array from all six walls with apex on top and base at the bottom with ECG and a 3D surface reconstruction, velocity and strain rate in systole and diastole. The bull's eye projection shows all of the surface, but the area is distorted; the apex is progressively diminished, while the base is over-represented, the 3D figure shows a representation of the true area, but has to be rotated to se all of the surface. Reconstruction is done from three separate cine-loops, synchronised by means of ECG. The ECG at the left is inverted, but is from the same patient, as may be seen by the end of the cycle, where there is noise in the ECG signal. The aortic annulus and location of the imaging planes are added for orientation.
Figure 2
Figure 2
Illustration of the four-dimensional data set. Drawing a curved M-mode along the wall (1a) in one plane, results in velocity data along a straight line. As data are recorded over a time period, adding the time sequence in each pixel of the line, results in a traditional curved M-mode plot. This is equivalent to a 2-dimensional surface (1b) with one spatial and one temporal dimension. However, the curved M-mode contains more information; the curvature itself defines the location of each point in space relative to all the others. With this information added, the M-mode is a curve in a plane, i.e. a two-dimensional figure (2a) instead of a straight line. If the time-sequence is added to this figure, analogous to the transition 1c, it results in a curved plane, a three-dimensional figure, with two spatial and one temporal dimension (2b). This kind of display is not used in practice; it is included here for reasons of analogy only. Adding two more curved M-modes from the two other standard planes and information about their angular separation, results in a three-dimensional figure, a grid (3a) the spatial interpolation is done by cubic spline. When the time-sequence is added in this case, the data set becomes four-dimensional (3b). This cannot be shown directly, but is illustrated by the analogy to 1 and 2b. Only part of the information can be extracted at a time, for the various display modalities: Bull's eye at any point in the heart cycle (4a), M-mode array (4b), 3D surface (4c). Only the processing to the full data set, however, allows the figures to be scrolled through the heart cycle, and the data set remains quantitative, allowing the curves to be extracted from each point.
Figure 3
Figure 3
Strain rate examples from two patients with myocardial infarction. Bull's eye, M-mode array and 3D surface display. Top half, inferior infarction (patient 2), showing slight systolic dyskinesia to hypokinesia – blue to light yellow – in the basal inferior and inferoseptal segments, hypokinesia in the inferior midwall. Post systolic shortening is shown over a larger area in the same region, visible on bull's eye (2) and M-mode. The 3D display is shown in mid-systole, the three frames illustrates the application's ability to rotate the display, here counter clockwise around the longitudinal axis. In addition is shown the strain rate curves from the infarct in red, demonstrating akinesia and post systolic shortening, and from a normal segment in green, showing normal systolic shortening with peak systolic strain rate of < -1 s-1, and diastolic lengthening. Bottom half shows an anteroapical infarct (patient 6), with a small area of dyskinesia, surrounded by a larger area of hypokinesia. (A very small area of inverted colour due to angular distortion can be seen.) Again, the area of post systolic shortening is in the same region, but larger, the difference probably being the ischemic border zone. The 3D reconstruction, systole in the upper row, and early diastole in the lower row, is rotated from an anterior to an apical view. Faulty ECG trigging on the scanner can be seen by the ECG curves on this patient, showing that the reconstruction must be inhomogenous.
Figure 4
Figure 4
Bull's eye views of all subjects in the study. The colour legends are reproduced, with yellow to red being shortening, blue being lengthening, and deeper colour means greater magnitude of either shortening or lengthening. The same colour legend is used for strain rate and strain, but the scales differ somewhat, resulting deeper colour in the strain images. The two upper rows are the normal subjects, mid systolic strain rate and end systolic strain. In control subjects 2 and 5 a small defect top left is seen, which is the aortic root. Large reverberations are seen in strain rate and strain in subject 4 and 6, and in strain in subject 3 as well. Reverberations are seen as circular bands at the midwall level, being due to the spatial interpolation process. In addition, basal artefacts are seen in subject 1, 5 and 6. Subject 6 shows areas of light colours due to dropouts as well. The three bottom rows are the infarction patients. Patients 2 and 4 had inferior, the rest apical infarctions. The infarcts have a more typical location, but the infarct in patient 4 may be difficult to separate from the basal artefacts in control subjects. In patient 5, there are reverberation artefacts as well, seen in the lateral base. The diagnosis of infarction was as easy with mid systolic strain rate as with end systolic strain, as is apparent in this figure. However, by adding post systolic shortening, the diagnosis of infarction was facilitated. Post systolic shortening was present in all six patients in this acute phase, and is seen to extend beyond the area of hypo- and dyskinesia in all. In the early diastolic images, there is visible inhomogeneity that is a normal phenomenon, not the results of pathology or reverberations. In some subjects small areas of inverted colour in the apex due to angular distortion can be seen, however, this area is small, and in most images it has been blanked.
Figure 5
Figure 5
The appearance of reverberations versus normal and pathological findings. Left to right: normal subject with good quality images (control 1), patient with anteroapical infarction (patient 6) and normal subject with poor image quality (control 4). Top to bottom: Strain rate bull's eyes, M-mode arrays and curves, Strain bull's eyes M-mode arrays, ECG and curves. The red colour of strain is seen to extend well into diastole normally, so post systolic shortening in pathology cannot be discerned by colour strain images. In the infarct, apical hypo- to akinesia is visible in all modalities, and post systolic shortening in colour strain rate and both strain rate and strain curves. Reverberations are seen as midwall circular lines of inverted colour in the bull's eye, and as horizontal lines of inverted colour in the M-modes. In strain rate curve it may give the impression of akinesia with post-systolic shortening (although not quite typical), but the horizontal lines of reverberations in M-mode array is typical. In strain, findings are typical reverberations, also in the curve.

Similar articles

Cited by

References

    1. Sutherland GR, Stewart MJ, Groundstroem KW, Moran CM, Fleming A, Guell-Peris FJ, Riemersma RA, Fenn LN, Fox KA, McDicken WN. Color Doppler myocardial imaging: a new technique for the assessment of myocardial function. J Am Soc Echocardiogr. 1994;7:441–58. - PubMed
    1. Pan C, Hoffmann R, Kuhl H, Severin E, Franke A, Hanrath P. Tissue tracking allows rapid and accurate visual evaluation of left ventricular function. Eur J Echocardiogr. 2001;2:197–202. doi: 10.1053/euje.2001.0098. - DOI - PubMed
    1. Höglund C, Alam M, Thorstrand C. Atrioventricular valve plane displacement in healthy persons. An echocardiographic study. Acta Med Scand. 1988;224:557–562. - PubMed
    1. Simonson JS, Schiller NB. Descent of the base of the left ventricle: an echocardiographic index of left ventricular function. J Am Soc Echocardiogr. 1989;2:25–35. - PubMed
    1. Alam M, Hoglund C, Thorstrand C. Longitudinal systolic shortening of the left ventricle: an echocardiographic study in subjects with and without preserved global function. Clin Physiol. 1992;12:443–52. - PubMed

Publication types

MeSH terms