Spatial distribution of Rhodopseudomonas palustris ecotypes on a local scale
- PMID: 12957901
- PMCID: PMC194914
- DOI: 10.1128/AEM.69.9.5192-5197.2003
Spatial distribution of Rhodopseudomonas palustris ecotypes on a local scale
Abstract
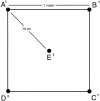
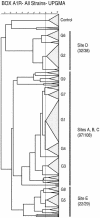
The number, spatial distribution, and significance of genetically distinguishable ecotypes of prokaryotes in the environment are poorly understood. Oda et al. (Y. Oda, B. Star, L. A. Huisman, J. C. Gottschal, and L. J. Forney, Appl. Environ. Microbiol. 69:xxx-xxx, 2003) have shown that Rhodopseudomonas palustris ecotypes were lognormally distributed along a 10-m transect and that multiple strains of the species could coexist in 0.5-g sediment samples. To extend these observations, we investigated the clonal diversity of R. palustris in 0.5-g samples taken from the corners and center of a 1-m square. A total of 35 or 36 clones were recovered by direct plating from each sample and were characterized by BOX A1R repetitive element-PCR genomic DNA fingerprinting. Isolates with fingerprint images that were >/=80% similar to each other were defined as the same genotype. Among the 178 isolates studied, 32 genotypes were identified, and each genotype contained between 1 and 40 isolates. These clusters were consistent with minor variations found in 16S rRNA gene sequences. The Shannon indices of the genotypic diversity within each location ranged from 1.08 (5 genotypes) to 2.18 (13 genotypes). Comparison of the rank abundance of genotypes found in pairs of locations showed that strains from three locations were similar to each other, with Morisita-Horn similarity coefficients ranging from 0.59 to 0.71. All comparisons involving the remaining two locations resulted in coefficients between 0 and 0.12. From these results we inferred that the patterns of ecotype diversity at the sampling site are patchy at a 1-m scale and postulated that factors such as mixing, competitive interactions, and microhabitat variability are likely to be responsible for the maintenance of the similarities between some locations and the differences between others.
Figures


Similar articles
-
Biogeography of the purple nonsulfur bacterium Rhodopseudomonas palustris.Appl Environ Microbiol. 2003 Sep;69(9):5186-91. doi: 10.1128/AEM.69.9.5186-5191.2003. Appl Environ Microbiol. 2003. PMID: 12957900 Free PMC article.
-
Genotypic and phenotypic diversity within species of purple nonsulfur bacteria isolated from aquatic sediments.Appl Environ Microbiol. 2002 Jul;68(7):3467-77. doi: 10.1128/AEM.68.7.3467-3477.2002. Appl Environ Microbiol. 2002. PMID: 12089030 Free PMC article.
-
Descriptions of Rhodopseudomonas parapalustris sp. nov., Rhodopseudomonas harwoodiae sp. nov. and Rhodopseudomonas pseudopalustris sp. nov., and emended description of Rhodopseudomonas palustris.Int J Syst Evol Microbiol. 2012 Aug;62(Pt 8):1790-1798. doi: 10.1099/ijs.0.026815-0. Epub 2011 Oct 10. Int J Syst Evol Microbiol. 2012. PMID: 21986724
-
Analysis of diversity among 3-chlorobenzoate-degrading strains of Rhodopseudomonas palustris.Microb Ecol. 2004 Jan;47(1):68-79. doi: 10.1007/s00248-003-1028-5. Microb Ecol. 2004. PMID: 15259271
-
Intrageneric relationships of members of the genus Rhodopseudomonas.J Gen Appl Microbiol. 2009 Dec;55(6):469-78. doi: 10.2323/jgam.55.469. J Gen Appl Microbiol. 2009. PMID: 20118611
Cited by
-
Elevational Gradients Impose Dispersal Limitation on Streptomyces.Front Microbiol. 2022 May 3;13:856263. doi: 10.3389/fmicb.2022.856263. eCollection 2022. Front Microbiol. 2022. PMID: 35592003 Free PMC article.
-
Functional Annotation Analytics of Rhodopseudomonas palustris Genomes.Bioinform Biol Insights. 2011;5:115-29. doi: 10.4137/BBI.S7316. Epub 2011 Sep 21. Bioinform Biol Insights. 2011. PMID: 22084572 Free PMC article.
-
Microbial community composition of the Danshui river estuary of Northern Taiwan and the practicality of the phylogenetic method in microbial barcoding.Microb Ecol. 2007 Oct;54(3):497-507. doi: 10.1007/s00248-007-9217-2. Epub 2007 Feb 22. Microb Ecol. 2007. PMID: 17318679
-
Genetic population structure of the soil bacterium Myxococcus xanthus at the centimeter scale.Appl Environ Microbiol. 2006 May;72(5):3615-25. doi: 10.1128/AEM.72.5.3615-3625.2006. Appl Environ Microbiol. 2006. PMID: 16672510 Free PMC article.
-
Biogeography of Nocardiopsis strains from hypersaline environments of Yunnan and Xinjiang Provinces, western China.Sci Rep. 2015 Aug 20;5:13323. doi: 10.1038/srep13323. Sci Rep. 2015. PMID: 26289784 Free PMC article.
References
Publication types
MeSH terms
Substances
LinkOut - more resources
Full Text Sources
Molecular Biology Databases

