. 2003 Sep;69(9):5519-29.
doi: 10.1128/AEM.69.9.5519-5529.2003.

Quantitative assessment of picoeukaryotes in the natural environment by using taxon-specific oligonucleotide probes in association with tyramide signal amplification-fluorescence in situ hybridization and flow cytometry

Affiliations

Quantitative assessment of picoeukaryotes in the natural environment by using taxon-specific oligonucleotide probes in association with tyramide signal amplification-fluorescence in situ hybridization and flow cytometry

Isabelle C Biegala et al. Appl Environ Microbiol. 2003 Sep.

Abstract

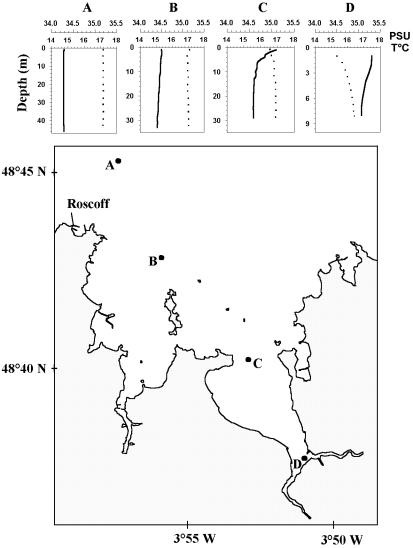
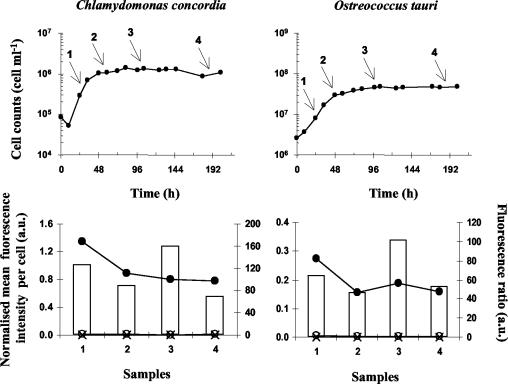
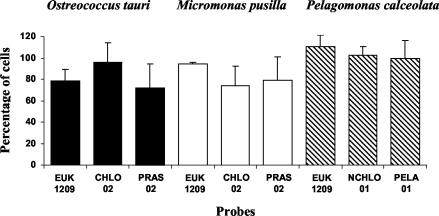
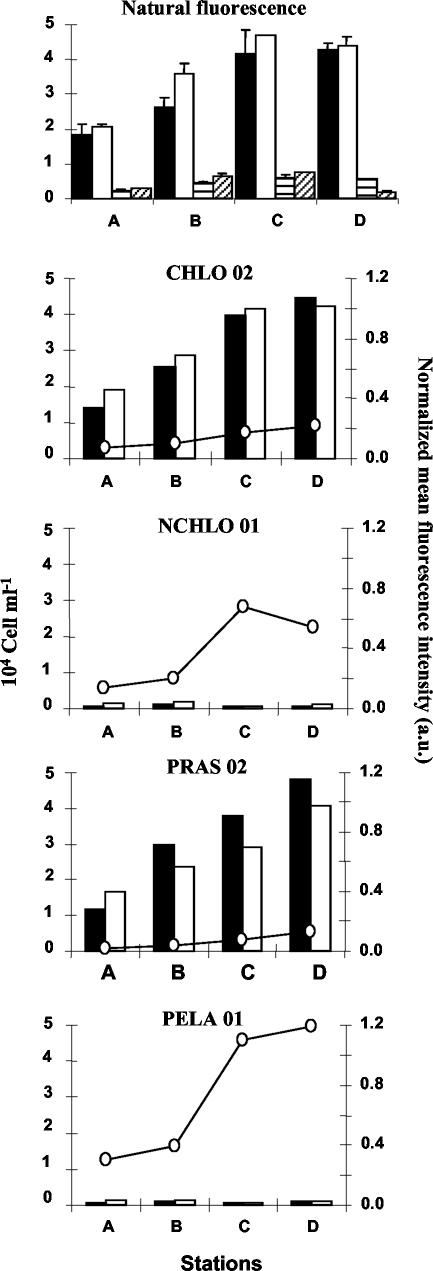
Picoeukaryotes (cells of <3 micro m in diameter) contribute significantly to marine plankton biomass and productivity, and recently molecular studies have brought to light their wide diversity. Among the methods that have been used so far to quantify aquatic microorganisms, fluorescence in situ hybridization of oligonucleotide probes combined with flow cytometry offers the advantages of both high resolution for taxonomic identification and automated cell counting. However, cell losses, cell clumps, and low signal-to-background ratio have often been mentioned as major problems for routine application of this combination of techniques. We developed a new protocol associating tyramide signal amplification-fluorescence in situ hybridization and flow cytometry, which allows the detection of picoeukaryotes in cultures during both the exponential and stationary phases. The use of surfactant and sonication proved to be essential for the detection and quantification of picoeukaryotes from the natural environment, with as little as a few tenths of a milliliter of 3- micro m-pore-size prefiltered sea water. The routine application of the technique was tested along a coastal transect off Brittany (France), where the different groups of picoeukaryotes were investigated using already published specific probes and a newly designed probe that targets the order Mamiellales (Prasinophyceae, Chlorophyta). Among the picoeukaryotes, Mamiellales outnumbered by 1 order of magnitude both the cyanobacteria and the non-Chlorophyta, which were represented mainly by the Pelagophyceae class. Picoeukaryote abundance increased from open toward more estuarine water, probably following changes in water temperature and stability.


Figures

FIG. 1.
FIG. 1.
Localization of the different stations (stations A to D) along the transect studied on 17 July 2002 in the Bay of Morlaix on the coast of Brittany. Temperature (T°C, full line) and salinity (PSU, dotted line) profiles are given for each station.
FIG. 2.
FIG. 2.
Cytograms of picoeukaryotes cultures (O. tauri, M. pusilla, and P. calceolata) hybridized with specific probes (circled populations), nonspecific probes, and no probe (control). The cell hybridized with the probes were labeled with fluorescein using the TSA-FISH technique (green fluorescence). All the DNA-containing cells were labeled with PI (red fluorescence). Hybridization was performed either on nonsonicated cells or on sonicated cells. Sonication prevents cells from clumping together (arrows). b, 0.95-μm fluorescent beads; a.u., arbitrary units.
FIG. 3.
FIG. 3.
Histograms representing the fluorescence ratio between populations of O. tauri hybridized with either specific (CHLO 02) or nonspecific (NCHLO 01) probes revealed by the TSA-FISH technique. Fluorescence ratios were calculated from fluorescence intensities measured by flow cytometry, either on hybridized cells previously stored in ethanol (black) or in hybridization buffer (white) for up to 8 months (A) or on hybridized cells kept for up to 2 months at 4°C in PBS (pH 7.4) (B).
FIG. 4.
FIG. 4.
Detection of nanoplanktonic (C. concordia) and picoplanktonic (O. tauri) species at different growth stages by TSA-FISH and flow cytometry. Cells were hybridized with the specific probe CHLO 02 (•) and the nonspecific probe NCHLO 01 (○). A no-probe control was also used (×). The mean fluorescence intensity is normalized to 0.95-μm fluorescent beads, and histograms show the fluorescence ratio between a specific (CHLO 02) and a nonspecific (NCHLO 01) signal. Arrows, stages at which the cells were sampled for hybridization; a.u., arbitrary units.
FIG. 5.
FIG. 5.
Percent cell recovery of different cultures of picoeukaryotes hybridized with probes targeting different taxonomic levels (TSA-FISH technique). Hybridized cells were counted by flow cytometry after PI counterstaining and sonication. Error bars correspond to two replicates.
FIG. 6.
FIG. 6.
Cytograms and confocal micrographs for the natural picoeukaryote community from station D (Fig. 1) hybridized with division-, class-, or order-specific probes (Table 3) and without a probe (control). The cell hybridized by probes were colored (TSA-FISH technique) with FITC (green fluorescence), and cell DNA was stained with PI (red fluorescence). Positively hybridized populations are circled. b, 0.95-μm fluorescent beads. Solid-head arrows, probe-labeledcells; open-head arrows, unidentified particles; bars, 5 μm; a.u., arbitrary units.
FIG. 7.
FIG. 7.
Cell counts obtained on natural picoeukaryote communities sampled at stations A, B, C, and D along a transect in the Bay of Morlaix (Fig. 1). The top panel shows a comparison of cell counts, based on the natural fluorescence of picoeukaryotes (black and whitebars) and cyanobacteria (striped bars), between two methods: concentrations of fixed cells by centrifugation prior to hybridization (black and horizontally striped bars) and cell fixation without centrifugation (white and diagonally striped bars). The bottom four panels show a comparison of cell counts and mean fluorescence intensity of hybridized cells with different probes (Table 2). Cells were counted either by flow cytometry (black bars) or by fluorescence microscopy (white bars). a.u., arbitrary units. Error bars correspond to two replicates.

References

    1. Amann, R. I., B. J. Binder, R. J. Olson, S. W. Chisholm, R. Devereux, and D. A. Stahl. 1990. Combination of 16S rRNA-targeted oligonucleotide probes with flow cytometry for analysing mixed microbial populations. Appl. Environ. Microbiol. 56:1919-1925. - PMC - PubMed
    1. Amann, R. I., L. Krumholz, and D. A. Stahl. 1990. Fluorescent-oligonucleotide probing of whole cells for determinative, phylogenetic, and environmental studies in microbiology. J. Bacteriol. 172:762-770. - PMC - PubMed
    1. Amann, R. I., B. Zarda, D. A. Stahl, and K.-H. Schleifer. 1992. Identification of individual prokaryotic cells by using enzyme-labeled, rRNA-targeted oligonucleotide probes. Appl. Environ. Microbiol. 58:3007-3011. - PMC - PubMed
    1. Andersen, R. A., G. W. Saunders, M. P. Paskind, and J. P. Sexton. 1993. Ultrastructure and 18S rRNA gene sequence for Pelagomonas calceolata gen. et sp. nov. and the description of a new algal class, the Pelagophyceae classis nov. J. Phycol. 29:701-715.
    1. Båmstedt, U., and H. R. Skjoldal. 1976. Studies on the deep water pelagic community of Korfjorden, western Norway. Adenosine phosphate and nucleic acids in Euchaeta norvegica (Copepoda) in relation to its life cycle. Sarsia 60:63-80.

Publication types

Substances

LinkOut - more resources