

Differences in hyporheic-zone microbial community structure along a heavy-metal contamination gradient
- PMID: 12957946
- PMCID: PMC194920
- DOI: 10.1128/AEM.69.9.5563-5573.2003
Differences in hyporheic-zone microbial community structure along a heavy-metal contamination gradient
Abstract
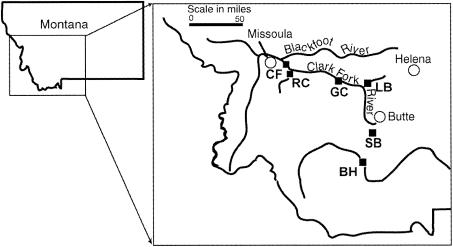
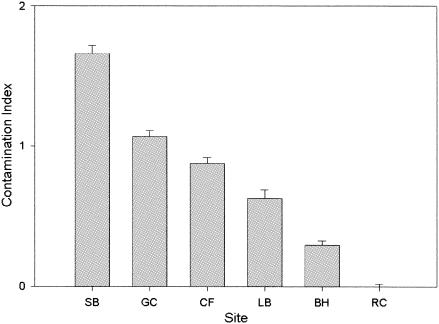
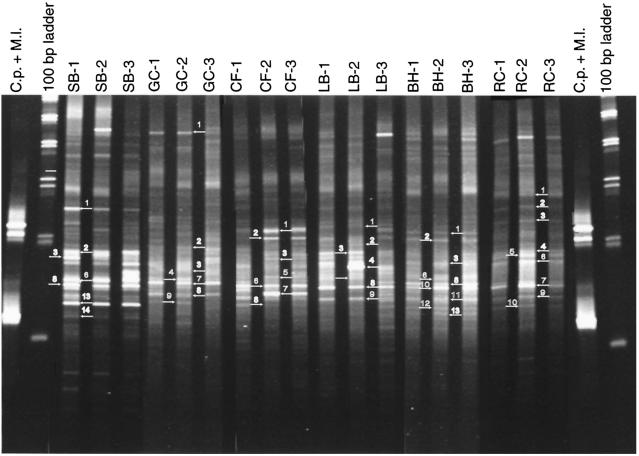
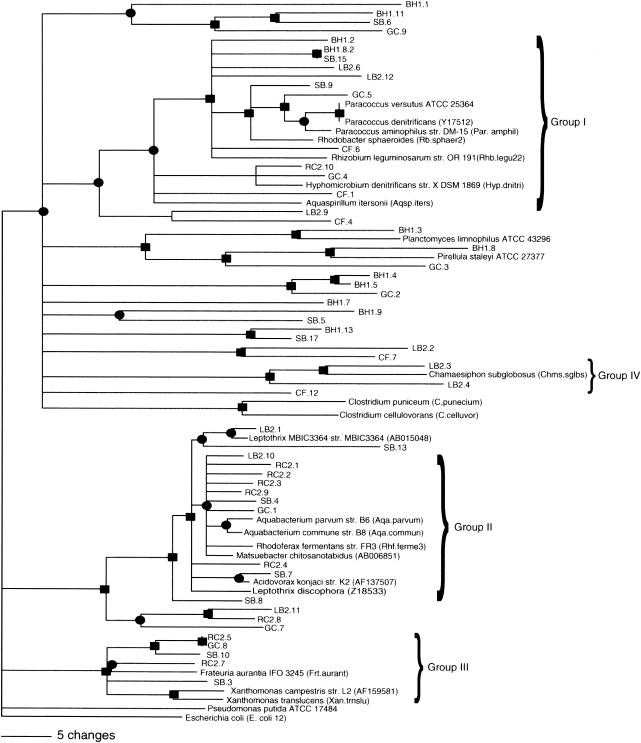
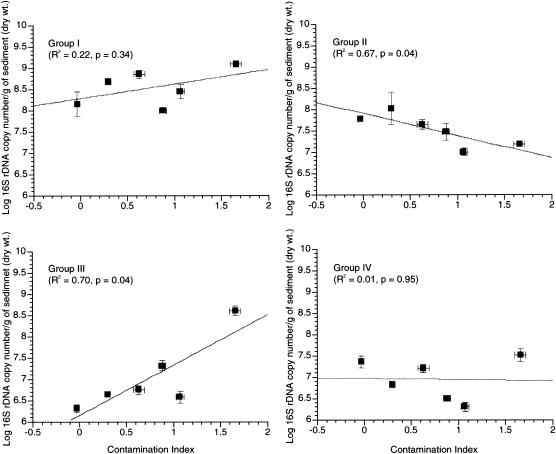
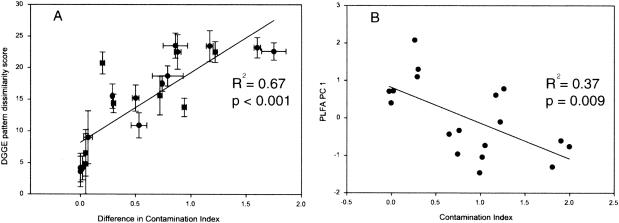
The hyporheic zone of a river is nonphotic, has steep chemical and redox gradients, and has a heterotrophic food web based on the consumption of organic carbon entrained from downwelling surface water or from upwelling groundwater. The microbial communities in the hyporheic zone are an important component of these heterotrophic food webs and perform essential functions in lotic ecosystems. Using a suite of methods (denaturing gradient gel electrophoresis, 16S rRNA phylogeny, phospholipid fatty acid analysis, direct microscopic enumeration, and quantitative PCR), we compared the microbial communities inhabiting the hyporheic zone of six different river sites that encompass a wide range of sediment metal loads resulting from large base-metal mining activity in the region. There was no correlation between sediment metal content and the total hyporheic microbial biomass present within each site. However, microbial community structure showed a significant linear relationship with the sediment metal loads. The abundances of four phylogenetic groups (groups I, II, III, and IV) most closely related to alpha-, beta-, and gamma-proteobacteria and the cyanobacteria, respectively, were determined. The sediment metal content gradient was positively correlated with group III abundance and negatively correlated with group II abundance. No correlation was apparent with regard to group I or IV abundance. This is the first documentation of a relationship between fluvially deposited heavy-metal contamination and hyporheic microbial community structure. The information presented here may be useful in predicting long-term effects of heavy-metal contamination in streams and provides a basis for further studies of metal effects on hyporheic microbial communities.
Figures
Similar articles
-
Hyporheic microbial community development is a sensitive indicator of metal contamination.Environ Sci Technol. 2009 Aug 15;43(16):6158-63. doi: 10.1021/es9005465. Environ Sci Technol. 2009. PMID: 19746707
-
Seasonal dynamics of shallow-hyporheic-zone microbial community structure along a heavy-metal contamination gradient.Appl Environ Microbiol. 2004 Apr;70(4):2323-31. doi: 10.1128/AEM.70.4.2323-2331.2004. Appl Environ Microbiol. 2004. PMID: 15066828 Free PMC article.
-
Determining rates of change and evaluating group-level resiliency differences in hyporheic microbial communities in response to fluvial heavy-metal deposition.Appl Environ Microbiol. 2004 Aug;70(8):4756-65. doi: 10.1128/AEM.70.8.4756-4765.2004. Appl Environ Microbiol. 2004. PMID: 15294812 Free PMC article.
-
Structure and seasonal dynamics of hyporheic zone microbial communities in free-stone rivers of the western United States.Microb Ecol. 2003 Aug;46(2):200-15. doi: 10.1007/BF03036883. Microb Ecol. 2003. PMID: 14708745
-
Structure of sediment-associated microbial communities along a heavy-metal contamination gradient in the marine environment.Appl Environ Microbiol. 2005 Feb;71(2):679-90. doi: 10.1128/AEM.71.2.679-690.2005. Appl Environ Microbiol. 2005. PMID: 15691917 Free PMC article.
Cited by
-
Stream microbial diversity in response to environmental changes: review and synthesis of existing research.Front Microbiol. 2015 May 18;6:454. doi: 10.3389/fmicb.2015.00454. eCollection 2015. Front Microbiol. 2015. PMID: 26042102 Free PMC article. Review.
-
A shallow BTEX and MTBE contaminated aquifer supports a diverse microbial community.Microb Ecol. 2004 Nov;48(4):589-600. doi: 10.1007/s00248-004-0001-2. Epub 2004 Oct 28. Microb Ecol. 2004. PMID: 15696392
-
Manure refinement affects apple rhizosphere bacterial community structure: a study in sandy soil.PLoS One. 2013 Oct 14;8(10):e76937. doi: 10.1371/journal.pone.0076937. eCollection 2013. PLoS One. 2013. PMID: 24155909 Free PMC article.
-
Metals Alter Membership but Not Diversity of a Headwater Stream Microbiome.Appl Environ Microbiol. 2021 Mar 11;87(7):e02635-20. doi: 10.1128/AEM.02635-20. Print 2021 Mar 11. Appl Environ Microbiol. 2021. PMID: 33452033 Free PMC article.
-
Microscale and molecular assessment of impacts of nickel, nutrients, and oxygen level on structure and function of river biofilm communities.Appl Environ Microbiol. 2004 Jul;70(7):4326-39. doi: 10.1128/AEM.70.7.4326-4339.2004. Appl Environ Microbiol. 2004. PMID: 15240316 Free PMC article.
References
-
- Admiraal, W., H. Blanck, M. Buckert-De Jong, H. Guasch, N. Ivorra, V. Lehmann, B. A. H. Nystrom, M. Paulsson, and S. Sabater. 1999. Short-term toxicity of zinc to microbenthic algae and bacteria in a metal polluted stream. Water Res. 33:1989-1996.
-
- Baker, M. A., C. N. Dahm, and H. M. Valett. 1999. Acetate retention and metabolism in the hyporheic zone of a mountain stream. Limnol. Oceanogr. 44:1530-1539.
-
- Barlocher, F., and J. H. Murdoch. 1989. Hyporheic biofilms: a potential food source for interstitial animals. Hydrobiologia 184:61-67.
Publication types
MeSH terms
Substances
LinkOut - more resources
Full Text Sources
Molecular Biology Databases
