

Electroencephalographic signatures of attentional and cognitive default modes in spontaneous brain activity fluctuations at rest
- PMID: 12958209
- PMCID: PMC196925
- DOI: 10.1073/pnas.1831638100
Electroencephalographic signatures of attentional and cognitive default modes in spontaneous brain activity fluctuations at rest
Abstract
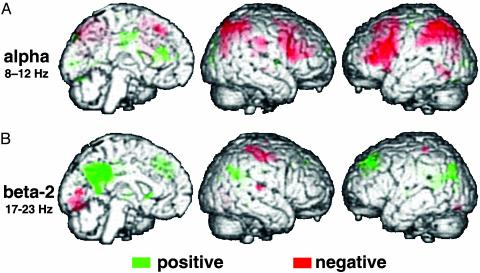
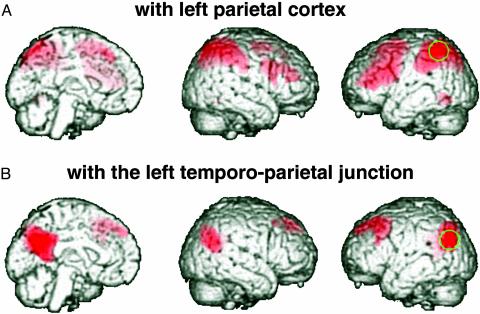
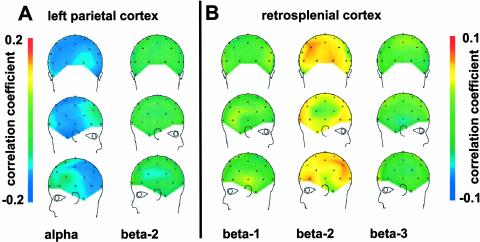
We assessed the relation between hemodynamic and electrical indices of brain function by performing simultaneous functional MRI (fMRI) and electroencephalography (EEG) in awake subjects at rest with eyes closed. Spontaneous power fluctuations of electrical rhythms were determined for multiple discrete frequency bands, and associated fMRI signal modulations were mapped on a voxel-by-voxel basis. There was little positive correlation of localized brain activity with alpha power (8-12 Hz), but strong and widespread negative correlation in lateral frontal and parietal cortices that are known to support attentional processes. Power in a 17-23 Hz range of beta activity was positively correlated with activity in retrosplenial, temporo-parietal, and dorsomedial prefrontal cortices. This set of areas has previously been characterized by high but coupled metabolism and blood flow at rest that decrease whenever subjects engage in explicit perception or action. The distributed patterns of fMRI activity that were correlated with power in different EEG bands overlapped strongly with those of functional connectivity, i.e., intrinsic covariations of regional activity at rest. This result indicates that, during resting wakefulness, and hence the absence of a task, these areas constitute separable and dynamic functional networks, and that activity in these networks is associated with distinct EEG signatures. Taken together with studies that have explicitly characterized the response properties of these distributed cortical systems, our findings may suggest that alpha oscillations signal a neural baseline with "inattention" whereas beta rhythms index spontaneous cognitive operations during conscious rest.
Figures
References
-
- Gusnard, D. A. & Raichle, M. E. (2001) Nat. Rev. Neurosci. 2, 685–694. - PubMed
-
- Arieli, A., Sterkin, A., Grinvald, A. & Aertsen, A. (1996) Science 273, 1868–1871. - PubMed
-
- Tsodyks, M., Kenet, T., Grinvald, A. & Arieli, A. (1999) Science 286, 1943–1946. - PubMed
-
- Leopold, D. A., Murayama, Y. & Logothetis, N. K. (2003) Cereb. Cortex 13, 422–433. - PubMed
Publication types
MeSH terms
LinkOut - more resources
Full Text Sources
