. 2003 Sep 16;100(19):11023-8.
doi: 10.1073/pnas.1834448100. Epub 2003 Sep 4.

Dynamic inhibition of excitatory synaptic transmission by astrocyte-derived ATP in hippocampal cultures

Affiliations

Dynamic inhibition of excitatory synaptic transmission by astrocyte-derived ATP in hippocampal cultures

Schuichi Koizumi et al. Proc Natl Acad Sci U S A. .

Abstract

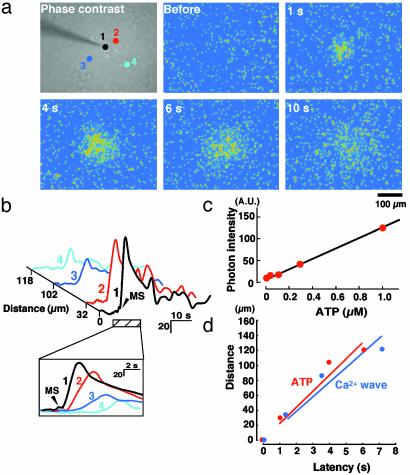
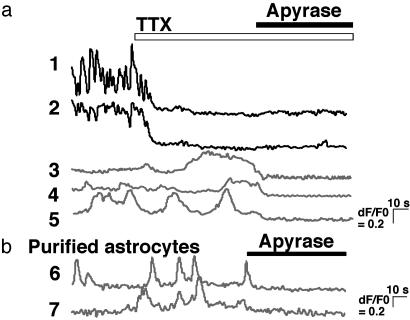
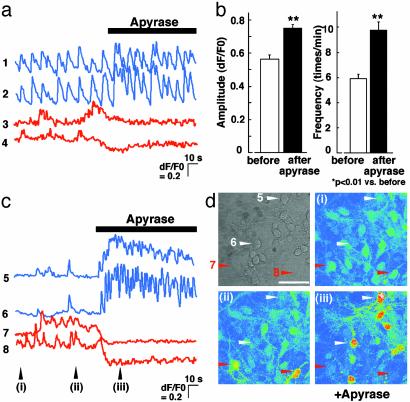
Originally ascribed passive roles in the CNS, astrocytes are now known to have an active role in the regulation of synaptic transmission. Neuronal activity can evoke Ca2+ transients in astrocytes, and Ca2+ transients in astrocytes can evoke changes in neuronal activity. The excitatory neurotransmitter glutamate has been shown to mediate such bidirectional communication between astrocytes and neurons. We demonstrate here that ATP, a primary mediator of intercellular Ca2+ signaling among astrocytes, also mediates intercellular signaling between astrocytes and neurons in hippocampal cultures. Mechanical stimulation of astrocytes evoked Ca2+ waves mediated by the release of ATP and the activation of P2 receptors. Mechanically evoked Ca2+ waves led to decreased excitatory glutamatergic synaptic transmission in an ATP-dependent manner. Exogenous application of ATP does not affect postsynaptic glutamatergic responses but decreased presynaptic exocytotic events. Finally, we show that astrocytes exhibit spontaneous Ca2+ waves mediated by extracellular ATP and that inhibition of these Ca2+ responses enhanced excitatory glutamatergic transmission. We therefore conclude that ATP released from astrocytes exerts tonic and activity-dependent down-regulation of synaptic transmission via presynaptic mechanisms.


Figures

Fig. 1.
Fig. 1.
Mechanically evoked Ca2+ waves in astrocytes are attenuated by apyrase. (a) Phase-contrast image (leftmost panel) and ratiometric images of fura 2 fluorescence images of a field of hippocampal cultured cells in which an astrocyte (cell 1) was mechanically stimulated by gentle contact with a glass pipette. Ratiometric images were taken during stimulation (0 s) and 4 and 12 s after stimulation. (b) Phase-contrast image (leftmost panel) and ratiometric images of fura 2 fluorescence in a different field of hippocampal astrocytes in which cell 1 was mechanically stimulated in the presence of apyrase (grade III, 20 units/ml). (Scale bar in a and b, 100 μm.) (c) The graph shows plots of ratiometric fura 2 fluorescence as a function of time in the four individual astrocytes indicated in the leftmost panel in a. The plots for the nonstimulated cells (cells 2–4) are displaced horizontally in proportional to their distance from the stimulated cell (cell 1) as indicated by the scale. (Inset) The traces from the stimulated cell (dark trace) and neighboring cells (light traces) are temporally aligned for the time course indicated by the hatched bar in the graph. The arrowhead indicates mechanical stimulation. (d) Same as c for the cells shown in the leftmost panel in b in which cell 1 was mechanically stimulated in the presence of apyrase.
Fig. 2.
Fig. 2.
Mechanical stimulation of astrocytes evokes an increase in extracellular ATP. (a) A phase-contrast image (Upper Left) and pseudocolor images of ATP bioluminescence in astrocytes. Astrocytes were bathed in luciferin–luciferase reagent and stimulated mechanically. ATP images were taken by a high-sensitivity CCD camera coupled with an image intensifier at an exposure time of 500 ms. (b) The graph shows plots of ATP bioluminescence as a function of time in the four individual astrocytes indicated in the phase-contrast image in a. The plots for the nonstimulated cells (cells 2–4) are displaced horizontally in proportion to their distance from the stimulated cell (cell 1), as indicated by the scale. (Inset) Traces from the stimulated cell (dark trace) and neighboring cells (traces 2–4) are temporally aligned for the time course indicated by the hatched bar in the graph. The standard calibration curve obtained from our imaging method is shown in c. Each ATP standard solution was injected into the chamber, and then the averaged ATP chemiluminescence of the whole microscopic field was obtained with exposure times of 500 ms. The correlation coefficient was 0.99. (d) Comparison of the spread of ATP signals and Ca2+ waves in typical coverslips. Four different astrocytes were chosen in the microscopic field, and each distance from the stimulated cell was plotted against its latency for ATP signals (red) and Ca2+ waves (blue). ATP signals and Ca2+ waves were obtained from different coverslips. The averaged velocity for ATP signals and Ca2+ waves was 22.5 ± 2.2 μm/s(n = 9) and 21 ± 1.7 μm/s(n = 37), respectively.
Fig. 3.
Fig. 3.
Stimulation of astrocytic Ca2+ waves causes a decrease in the frequency of neuronal Ca2+ oscillations. (a) Image of a field of hippocampal cultures that were fixed and stained with anti-MAP2 (green) and anti-GFAP (red) antibodies. (Scale bar, 50 μm.) (b) The graph shows individual traces of ratiometric fura 2 fluorescence in a neuron (cell 1) and astrocyte (cell 2) shown in a before fixation and staining. ATP (1 μM) was bath applied as indicated by the bar. (c Left) Ratiometric image of fura 2 fluorescence superimposed on a phase-contrast image of a field of hippocampal cultured cells. (c Right) Astrocytes (cells 1–3in Left) are schematically shown as red and neurons (cells 4–6) are shown as blue. Astrocyte 1 was mechanically stimulated as indicated by the arrowhead. (Scale bar, 50 μm.) (d) The graph shows individual traces of ratiometric fura 2 fluorescence as a function of time in the astrocytes (traces 1–3) and neurons (4–6) indicated in c. Astrocyte 1 was mechanically stimulated twice, separated by 10 min (the arrowheads, MS1 and MS2). (e) The histogram shows the mean ± SEM frequency of Ca2+ oscillations in neurons (n = 73 neurons in four experiments) measured every 60 s before and after an astrocyte was mechanically stimulated (arrowheads). The Ca2+ oscillation frequency was normalized to the prestimulation level. (f) Ratiometric and schematic images of a field of hippocampal cultured cells in which astrocytes are shown in red and neurons are shown in blue. (Scale bar, 50 μm.) (g) Individual traces of ratiometric fura 2 fluorescence in the astrocytes (1–3) and neurons (4–7) shown in f. Astrocyte 1 was mechanically stimulated (arrowheads) under normal conditions and 10 min later was mechanically stimulated in the presence of apyrase (20 units/ml; hatched bar). (h) The histogram shows the mean ± SEM frequency of Ca2+ oscillations in neurons before stimulation (Pre; n = 48 neurons in five experiments), after the application of exogenous ATP (1 μM; n = 36 neurons in five experiments), mechanical stimulation of astrocytes (MS; n = 51 neurons in six experiments), and mechanical stimulation of astrocytes in the presence of apyrase (MS/apyrase; n = 38 neurons in five experiments). Ca2+ oscillation frequency was normalized to the prestimulation level (Pre). Asterisks show significant difference from the response of Pre (**, P < 0.01; Student's t test).
Fig. 4.
Fig. 4.
Exogenous ATP causes a decrease in presynaptic exocytotic events. (a) A phase-contrast image of cultured hippocampal neurons. (b) Image of FM1-43 fluorescence in the same field as a. (c) Same field of hippocampal neurons as in a fixed and stained with anti-synaptophysin antibody after KCl (50 mM)-induced depolarization. (d) Merged image of FM1-43 and anti-synaptophysin fluorescence. (e) The graph shows the mean ± SEM levels of relative FM1-43 fluorescence before and after the application of KCl (50 mM) under control conditions (b; n = 46), in the presence of ω-Conotoxin GVIA (ω-CTx; 1 μM; n = 18) and ATP (0.3 μM, n = 41; 3 μM, n = 16; 30 μM, n = 36). (f) The mean ± SEM amount of release 50 s after the application of KCl under control conditions (open bar, n = 46), in the presence of various concentration of ATP (red bars; n = 16∼41) and in the presence of ω-CTx (n = 18). (Inset) Effects of various concentrations of ATP (red bars; 0.1–30 μM, n = 10–15) on the KCl-evoked (50 mM) glutamate release measured by HPLC. Values are normalized to those evoked under control conditions. Asterisks show significant differences from the response of KCl alone (*, P < 0.05; **, P < 0.01; Student's t test).
Fig. 5.
Fig. 5.
Astrocytic Ca2+ oscillations are abolished by apyrase. (a) Self-ratios of fluo-4 fluorescence in cocultured hippocampal neurons (traces 1 and 2) and astrocytes (traces 3–5) obtained from confocal laser microscopy. TTX (1 μM) was applied as indicated by the open bar, and apyrase (20 units/ml) was applied as indicated by the filled bar. (b) Self-ratios of fluo-4 fluorescence in purified astrocyte cultures (traces 6 and 7). Apyrase (20 units/ml) was applied as indicated by the bar.
Fig. 6.
Fig. 6.
Frequency and amplitude of neuronal Ca2+ oscillations are increased by apyrase. (a) Self-ratios of fluo-4 fluorescence in cocultured hippocampal neurons (traces 1 and 2) and astrocytes (traces 3 and 4) obtained from confocal laser microscopy. Apyrase (20 units/ml) was applied as indicated by the bar. (b) The mean ± SEM amplitude (Left) and frequency (Right) of neuronal Ca2+ oscillations before (open bar) and after (filled bar) application of apyrase. (c) Self-ratios of fluo-4 fluorescence in a representative example of a field of hippocampal neurons (traces 5 and 6) and astrocytes (traces 7 and 8) in which the neurons exhibited relatively small Ca2+ oscillations. Apyrase (20 units/ml) was applied as indicated by the bar. (d) A phase-contrast image and pseudocolor images (iiii) of fluo-4 self-ratios at time points i, ii, and iii in c. (Scale bar, 50 μm.)

References

    1. Haydon, P. G. (2001) Nat. Rev. Neurosci. 2, 185–193. - PubMed
    1. Newman, E. A. & Zahs, K. R. (1997) Science 275, 844–847. - PMC - PubMed
    1. Guthrie, P. B., Knappenberger, J., Segal, M., Bennett, M. V., Charles, A. C. & Kater, S. B. (1999) J. Neurosci. 19, 520–528. - PMC - PubMed
    1. Fam, S. R., Gallagher, C. J. & Salter, M. W. (2000) J. Neurosci. 20, 2800–2808. - PMC - PubMed
    1. Parpura, V., Basarsky, T. A., Liu, F., Jeftinija, K., Jeftinija, S. & Haydon, P. G. (1994) Nature 369, 744–747. - PubMed

Publication types

LinkOut - more resources