. 2003 Sep 16;100(19):10722-7.
doi: 10.1073/pnas.1932552100. Epub 2003 Sep 5.

Brain imaging in awake infants by near-infrared optical topography

Affiliations

Brain imaging in awake infants by near-infrared optical topography

Gentaro Taga et al. Proc Natl Acad Sci U S A. .

Abstract

Studies of young infants are critical to understand perceptual, motor, and cognitive processing in humans. However, brain mechanisms involved are poorly understood, because the use of brain-imaging methods such as functional magnetic resonance imaging in awake infants is difficult. In the present study we show functional brain imaging of awake infants viewing visual stimuli by means of multichannel near-infrared spectroscopy, a technique that permits a measurement of cerebral hemoglobin oxygenation in response to brain activation through the intact skull without subject constraint. We found that event-related increases in oxyhemoglobin were evident in localized areas of the occipital cortex of infants aged 2-4 months in response to a brief presentation of a checkerboard pattern reversal while they maintained fixation to attention-grabbing stimuli. The dynamic change in cerebral blood oxygenation was qualitatively similar to that observed in the adult brain. This result introduces near-infrared optical topography as a method for investigating the functional development of the brain in early infancy.


Figures
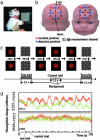
Fig. 1.
Fig. 1.
(a) Experimental setup. Each subject was seated on a parent's lap facing a computer display. The probes of the OT were attached to the occipital and frontal cortex. (b) Arrangement of measurement channels over the occipital and frontal cortex of infants by using OT. (c) Schematic diagrams of the experimental procedure. Ten cycles of test and control trials were recorded with each of the infant subjects. (d) Time series of relative changes in [oxy-Hb] (red line) and [deoxy-Hb] (green line) at channel 11 over the occipital cortex and at channel 23 over the frontal cortex of a 2-month-old infant. Black and gray bars indicate the test and control trials, respectively.
Fig. 2.
Fig. 2.
Time evolution of images of hemodynamic response to the test visual stimulation. Epoch-averaged images of [oxy-Hb] over the occipital and frontal cortex of a 4-month-old infant (S6) are illustrated at 2-s intervals. The time of initiation of test trial is at 0 s. The unit of [oxy-Hb] is a relative change from an arbitrary zero baseline at the start of the measurement period.
Fig. 3.
Fig. 3.
(a) Locations of significant changes in [oxy-Hb] and [deoxy-Hb] that were consistently observed among the subjects. The relative size of each red circle represents the number of the subjects who showed significant changes (P < 0.01) at the corresponding channel. For example, the largest circle at CH11 over the occipital cortex in [oxy-Hb] changes represents that six of the seven subjects showed significant changes in [oxy-Hb] at CH11. The channels illustrated with black dots indicate that none of the subjects showed a significant change. (b) Hemodynamic response of the occipital and frontal cortex averaged over all seven subjects. Shown are time courses of relative changes in [oxy-Hb] (red line) and [deoxy-Hb] (green line) at CH11 (Left) and CH24 (Right). Black bars indicate the periods during which the checkerboard pattern reversal was presented. (c) Topographic mappings of the activation of the occipital and frontal cortex in response to checkerboard pattern reversal stimulation for a 2-month-old (S1) and a 4-month-old (S6) infant. The color-coding topographic mapping was based on the spatial interpolation of F scores for the significant changes in [oxy-Hb] at 24 channels.

References

    1. Fantz, R. L. (1963) Science 140, 296–297. - PubMed
    1. Slater, A., Morison, V. & Somers, M. (1988) Perception 17, 597–602. - PubMed
    1. Taga, G., Ikejiri, T., Tachibana, T., Shimojo, S., Soeda, A., Takeuchi, K. & Konishi, Y. (2002) Perception 31, 273–286. - PubMed
    1. Ogawa, S., Tank, D. W., Menon, R., Ellermann, J. M., Kim, S.-G., Merkle, H. & Ugurbil, K. (1992) Proc. Natl. Acad. Sci. USA 89, 5951–5955. - PMC - PubMed
    1. Kwong, K. K., Belliveau, J. W., Chesler, D. A., Goldberg, I. E., Weisskoff, R. M., Poncelet, B. P., Kennedy, D. N., Hoppel, B. E., Cohen, M. S., Turner, R., et al. (1992) Proc. Natl. Acad. Sci. USA 89, 5675–5679. - PMC - PubMed

LinkOut - more resources