

Stearoyl-CoA desaturase 1 deficiency elevates insulin-signaling components and down-regulates protein-tyrosine phosphatase 1B in muscle
- PMID: 12960377
- PMCID: PMC196935
- DOI: 10.1073/pnas.1934571100
Stearoyl-CoA desaturase 1 deficiency elevates insulin-signaling components and down-regulates protein-tyrosine phosphatase 1B in muscle
Abstract
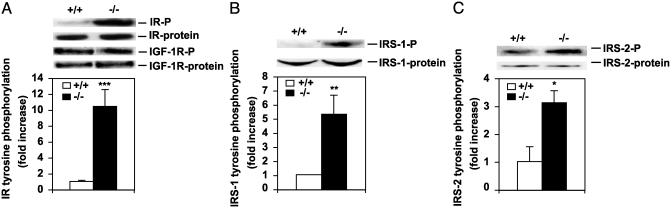
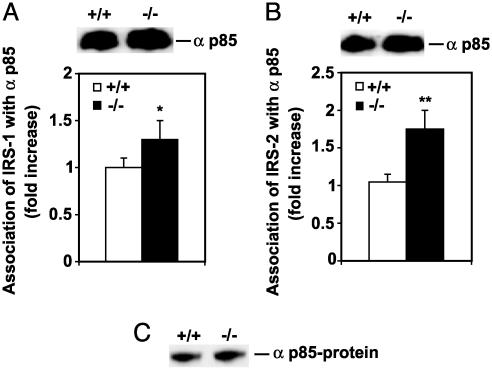
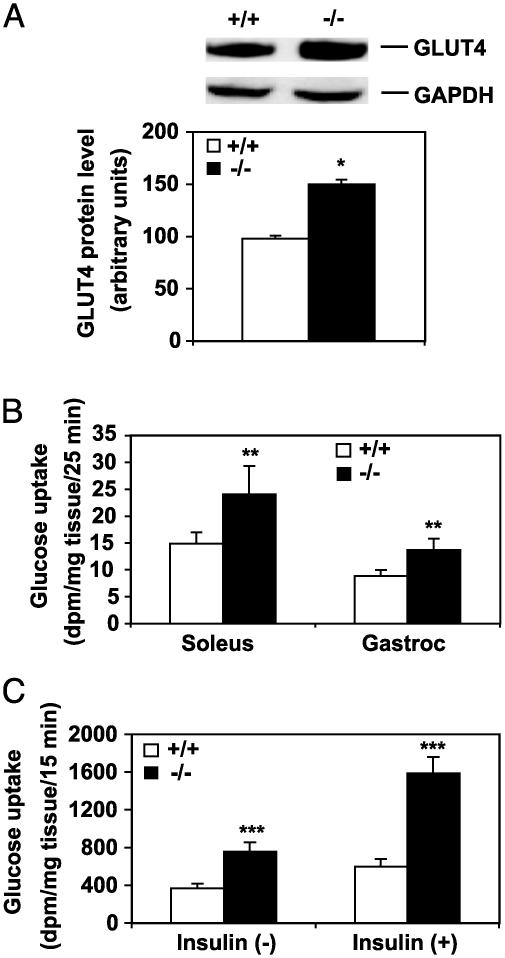
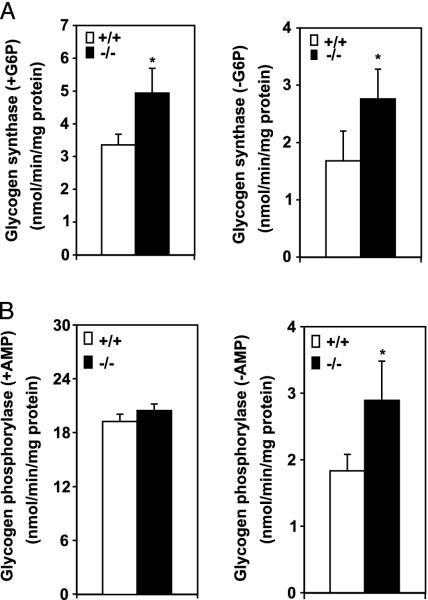
We have shown previously that mice with a targeted disruption in the stearoyl-CoA desaturase 1 gene (SCD1-/-) have increased insulin sensitivity compared with control mice. Here we show that the SCD1-/- mice have increased insulin signaling in muscle. The basal tyrosine phosphorylation of the insulin receptor and insulin receptor substrates 1 and 2 are elevated. The tyrosine phosphorylation of insulin-like growth factor-1 receptor was similar between SCD1+/+ and SCD1-/- mice. The association of insulin receptor substrates 1 and 2 with alphap85 subunit of phosphatidylinositol 3-kinase as well as the phosphorylation of Akt-Ser-473 and Akt-Thr-308 are also elevated in the SCD1-/- mice. Interestingly, the mRNA levels, protein mass, and activity of the protein-tyrosine phosphatase-1B implicated in the attenuation of the insulin signal are reduced in the SCD1-/- mice, whereas the levels of the leukocyte antigen-related protein phosphatase are similar between two groups of mice. The content of glucose transporter 4 in the plasma membrane and basal as well as insulin-mediated glucose uptake are increased in the SCD1-/- mice. In addition, the muscle glycogen content and the activities of glycogen synthase and phosphorylase are increased in the SCD1-/- mice. We hypothesize that loss of SCD1 function induces increased insulin signaling at least in part by a reduction in the expression of protein-tyrosine phosphatase 1B. SCD1 could be a therapeutic target in the treatment of diabetes.
Figures


References
-
- Enoch, H. G. & Strittmatter, P. (1978) Biochemistry 17, 4927-4932. - PubMed
-
- Miyazaki, M., Kim, Y.-C., Gray-Keller, M. P., Attie, A. D. & Ntambi, J. M. (2000) J. Biol. Chem. 275, 30132-30138. - PubMed
-
- Miyazaki, M., Kim, Y.-C. & Ntambi, J. M. (2001) J. Lipid Res. 42, 1018-1024. - PubMed
-
- Miyazaki, M., Man, W. C. & Ntambi, J. M. (2001) J. Nutr. 131, 2260-2268. - PubMed
-
- Storlien, L. H., Jenkins, A. B., Chisholm, D. J., Pascoe, W. S., Khouri, S. & Kraegen, E. W. (1991) Diabetes 40, 280-289. - PubMed
Publication types
MeSH terms
Substances
Grants and funding
LinkOut - more resources
Full Text Sources
Medical
Molecular Biology Databases
