. 2003 Sep 16;100(19):11041-6.
doi: 10.1073/pnas.1934665100. Epub 2003 Sep 5.

Chronic, multisite, multielectrode recordings in macaque monkeys

Affiliations

Chronic, multisite, multielectrode recordings in macaque monkeys

Miguel A L Nicolelis et al. Proc Natl Acad Sci U S A. .

Abstract

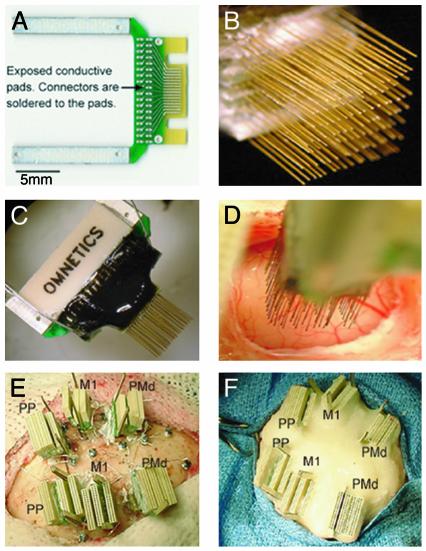
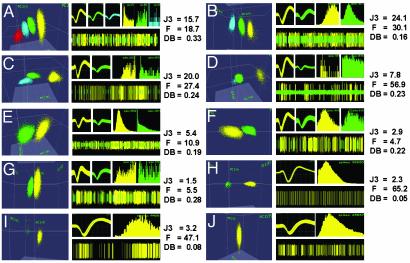
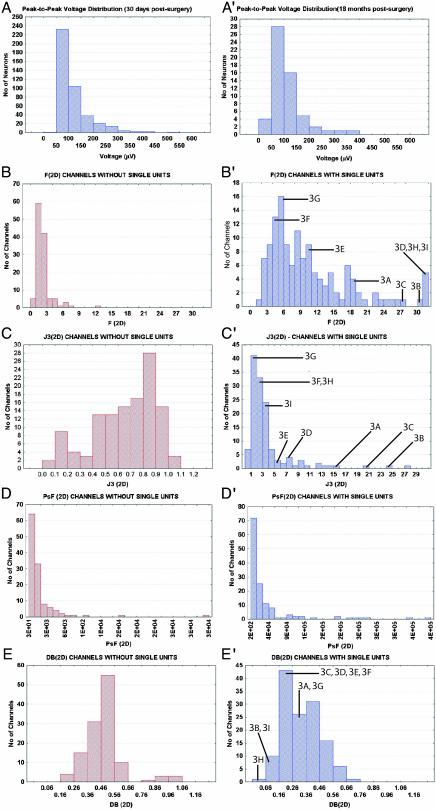
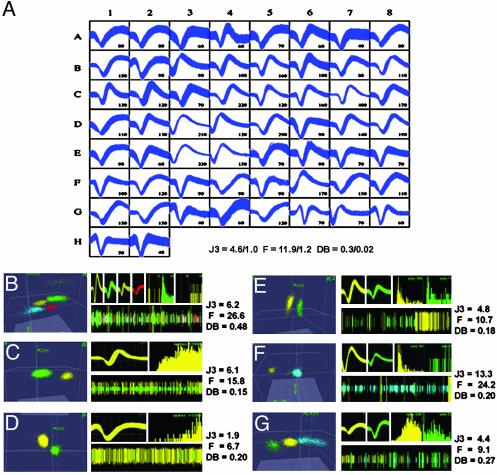
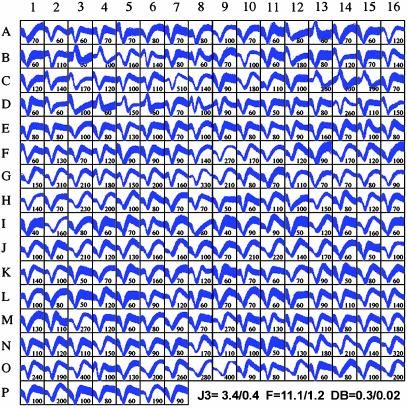
A paradigm is described for recording the activity of single cortical neurons from awake, behaving macaque monkeys. Its unique features include high-density microwire arrays and multichannel instrumentation. Three adult rhesus monkeys received microwire array implants, totaling 96-704 microwires per subject, in up to five cortical areas, sometimes bilaterally. Recordings 3-4 weeks after implantation yielded 421 single neurons with a mean peak-to-peak voltage of 115 +/- 3 microV and a signal-to-noise ratio of better than 5:1. As many as 247 cortical neurons were recorded in one session, and at least 58 neurons were isolated from one subject 18 months after implantation. This method should benefit neurophysiological investigation of learning, perception, and sensorimotor integration in primates and the development of neuroprosthetic devices.


Figures

Fig. 1.
Fig. 1.
(A) Printed circuit board (PCB) used to build a high-density microwire array (spacing between traces is 300 μm). (B) Multiple boards are stacked up to form arrays with up to 128 microwires. (C) High-density connectors are attached to the other side of the board. (D) Implantation of a 128-microwire array in the M1. (E) Last stages of a 672-microwire implant. Bilateral implants included the PMd, M1, and the PP. (F) Final aspect of a multisite implant after the application of multiple layers of dental cement.
Fig. 2.
Fig. 2.
Examples of cluster separation, 30 days postimplantation. Each example contains: (Left) identified clusters in 3D PC space; (Upper Middle) waveforms; (Upper Right) ISI histograms; (Lower Right) continuous record of potentials. Different colors depict distinct clusters in all parts of each example. J3 (2D), F (2D), and DB (2D) statistics are at the far right. (A) Three single units (yellow, green, and blue) discriminated from the multiunit record (red cluster) yielded high J3 and F values, average DB, clear differences in waveforms, and ISI histograms. (B) Two single units (green and yellow) were differentiated from the multiunit activity (blue), producing high J3 and F and low DB values. (C) High separation between the multiunit cluster (blue) and two units (yellow and green). (D) One large (yellow) and one small (green) unit were isolated from the multiunit activity (blue). (E) Two clearly distinct units were isolated. J3 was above the mean, DB was good, and F value was average. (F) Two units with distinct amplitudes and ISI histograms from a channel with below average J3 and F values. The DB value indicates good cluster separation. (G) Channel with low J3 and F values, but an average DB. Two units with distinct waveforms and ISI histograms were isolated. (H) Example of a large single unit (yellow) isolated from the multiunit activity (green). J3 was below average, F was very high, and DB was very low. (I) Single unit (yellow) clearly distinct from the multiunit activity (green). The J3 value was close to its mean, the F value was high, and DB was low, indicating excellent cluster separation. (J) A single unit (yellow cluster) isolated way above the multiunit voltage level. ISI histogram time scales were 5 ms (C), 10 ms (A, D, and G), and 100 ms (B, E, F, and HJ).
Fig. 3.
Fig. 3.
(A) Vpp distribution from 330 single neurons recorded in two monkeys, 30 days after the surgical implantation. (A′) Vpp distribution obtained for monkey 1, 18 months postsurgical implantation. Distributions of four cluster separation statistics for channels without isolated single units (BE) and with single units (B′–E′). (B) Distribution of F (2D) values for recording channels without single units. (B′) Distribution of F (2D) values for channels with single units. The locations in the distribution of the channels are indicated by labels and lines. (C) Distribution of J3 (2D) values for channels without single units. (C′) Distribution of J3 (2D) values for channels with single units. (D) Distribution of PsF (2D) values for channels without single units. (D′) Distribution of PsF (2D) values for channels with single units. (E) Distribution of DB (2D) values for channels without single units. (E′) Distribution of DB (2D) values for channels with single units.
Fig. 5.
Fig. 5.
(A) Waveform sample from 58 single neurons recorded 18 months after the implantation surgery. Numbers next to waveforms depict the mean Vpp (μV) of the action potentials. Right PMd (A1–B2), right M1 (B3–E6), right S1 (E7–F7), and right SMA (F8–H2). Mean ± SE J3 (2D), F (2D), and DB (2D) statistics for the sample are plotted at the bottom right. (BG) Single neuron isolation quality is illustrated as described in Fig. 3. (B) Four single units discriminated from the multiunit activity (blue). (C) Clear isolation of a single neuron (yellow) from the multiunit activity (green) is confirmed by high J3 and F values and a low DB. (D) Channel with a clear single unit, but with a smaller signal-to-noise ratio than C. ISI histograms show a clear refractory period. (E) Two clearly distinct single units produced clusters with average J3, close to average F, and low DB. (F) Two units (green and yellow) discriminated from the multiunit activity (blue) yielding high J3, F, and low DB statistics. Distinct ISIs, waveform shapes, and amplitudes further supported their designation as single units. (G) Channel with average J3 and slightly lower than average F and DB statistics. Clear differences in ISI histograms and waveform shape and amplitude confirm nice separation of units (green and yellow) from multiunit activity (blue). ISI histogram time scales are 10 ms (BF) and 100 ms (G).
Fig. 4.
Fig. 4.
Samples of action potentials from 247 single neurons recorded in monkey 3, 30 days after implantation. Sample includes left M1 (A1–F7), left PMd (F8–H7 and J3–K7), left S1 (H8–J2), right S1 (K8–N11), and right M1 (N12–P7). Numbers next to the sampled waveforms display their Vpp (μV). Mean ± SE J3 (2D), F (2D), and DB (2D) statistics for the sample are plotted at the bottom right.

References

    1. Evarts, E. V. (1960) Fed. Proc. 19, Suppl. 4, 828–837. - PubMed
    1. Wilson, M. A. & McNaughton, B. L. (1993) Science 261, 1055–1058. - PubMed
    1. Nicolelis, M. A. L., Lin, R. C. S., Woodward, D. J. & Chapin, J. K. (1993) Nature 361, 533–536. - PubMed
    1. Nicolelis, M. A. L., Lin, R. C., Woodward, D. J. & Chapin, J. K. (1993) Proc. Natl. Acad. Sci. USA 90, 2212–2216. - PMC - PubMed
    1. Nicolelis, M. A. L., Baccala, L. A., Lin, R. C. S. & Chapin, J. K. (1995) Science 268, 1353–1358. - PubMed

Publication types