

Resistance of virus to extinction on bottleneck passages: study of a decaying and fluctuating pattern of fitness loss
- PMID: 12960384
- PMCID: PMC196888
- DOI: 10.1073/pnas.1332668100
Resistance of virus to extinction on bottleneck passages: study of a decaying and fluctuating pattern of fitness loss
Abstract
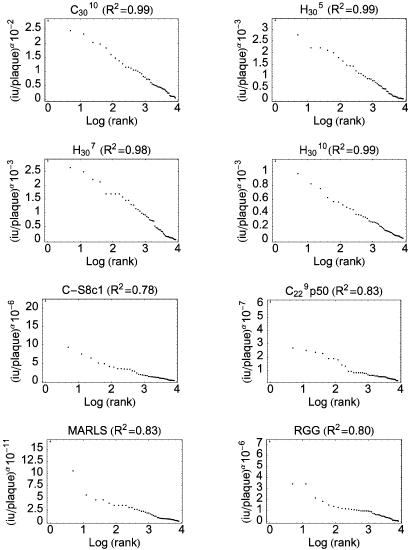
RNA viruses display high mutation rates and their populations replicate as dynamic and complex mutant distributions, termed viral quasispecies. Repeated genetic bottlenecks, which experimentally are carried out through serial plaque-to-plaque transfers of the virus, lead to fitness decrease (measured here as diminished capacity to produce infectious progeny). Here we report an analysis of fitness evolution of several low fitness foot-and-mouth disease virus clones subjected to 50 plaque-to-plaque transfers. Unexpectedly, fitness decrease, rather than being continuous and monotonic, displayed a fluctuating pattern, which was influenced by both the virus and the state of the host cell as shown by effects of recent cell passage history. The amplitude of the fluctuations increased as fitness decreased, resulting in a remarkable resistance of virus to extinction. Whereas the frequency distribution of fitness in control (independent) experiments follows a log-normal distribution, the probability of fitness values in the evolving bottlenecked populations fitted a Weibull distribution. We suggest that multiple functions of viral genomic RNA and its encoded proteins, subjected to high mutational pressure, interact with cellular components to produce this nontrivial, fluctuating pattern.
Figures
Similar articles
-
Modeling viral genome fitness evolution associated with serial bottleneck events: evidence of stationary states of fitness.J Virol. 2002 Sep;76(17):8675-81. doi: 10.1128/jvi.76.17.8675-8681.2002. J Virol. 2002. PMID: 12163587 Free PMC article.
-
Resistance to extinction of low fitness virus subjected to plaque-to-plaque transfers: diversification by mutation clustering.J Mol Biol. 2002 Jan 25;315(4):647-61. doi: 10.1006/jmbi.2001.5259. J Mol Biol. 2002. PMID: 11812137
-
Repeated bottleneck transfers can lead to non-cytocidal forms of a cytopathic virus: implications for viral extinction.J Mol Biol. 2008 Feb 15;376(2):367-79. doi: 10.1016/j.jmb.2007.11.042. Epub 2007 Nov 22. J Mol Biol. 2008. PMID: 18158159
-
Quasispecies dynamics and RNA virus extinction.Virus Res. 2005 Feb;107(2):129-39. doi: 10.1016/j.virusres.2004.11.003. Virus Res. 2005. PMID: 15649559 Review.
-
Foot-and-mouth disease virus evolution: exploring pathways towards virus extinction.Curr Top Microbiol Immunol. 2005;288:149-73. doi: 10.1007/3-540-27109-0_7. Curr Top Microbiol Immunol. 2005. PMID: 15648178 Free PMC article. Review.
Cited by
-
Viability of SARS-CoV-2 in river water and wastewater at different temperatures and solids content.Water Res. 2021 May 1;195:117002. doi: 10.1016/j.watres.2021.117002. Epub 2021 Mar 3. Water Res. 2021. PMID: 33714910 Free PMC article.
-
Is HIV-1 evolving to a less virulent form in humans?Nat Rev Microbiol. 2007 Feb;5(2):141-51. doi: 10.1038/nrmicro1594. Epub 2007 Jan 4. Nat Rev Microbiol. 2007. PMID: 17203103 Free PMC article. Review.
-
Mother-to-Child HIV Transmission Bottleneck Selects for Consensus Virus with Lower Gag-Protease-Driven Replication Capacity.J Virol. 2017 Aug 10;91(17):e00518-17. doi: 10.1128/JVI.00518-17. Print 2017 Sep 1. J Virol. 2017. PMID: 28637761 Free PMC article.
-
Genomic profile of eGFP-expressing canine distemper virus that undergoes serial plaque-to-plaque transfers.Front Cell Infect Microbiol. 2022 Sep 23;12:1006273. doi: 10.3389/fcimb.2022.1006273. eCollection 2022. Front Cell Infect Microbiol. 2022. PMID: 36211954 Free PMC article.
-
Evolution at increased error rate leads to the coexistence of multiple adaptive pathways in an RNA virus.BMC Evol Biol. 2013 Jan 16;13:11. doi: 10.1186/1471-2148-13-11. BMC Evol Biol. 2013. PMID: 23323937 Free PMC article.
References
Publication types
MeSH terms
LinkOut - more resources
Full Text Sources
