

Intra-G1 arrest in response to UV irradiation in fission yeast
- PMID: 12960401
- PMCID: PMC196876
- DOI: 10.1073/pnas.1833769100
Intra-G1 arrest in response to UV irradiation in fission yeast
Abstract
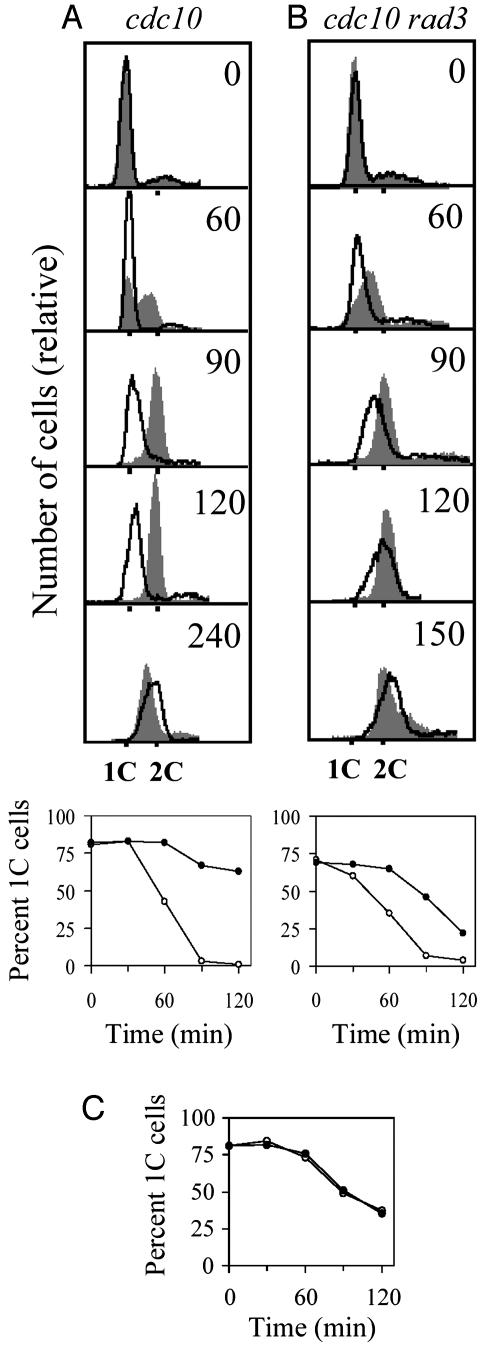
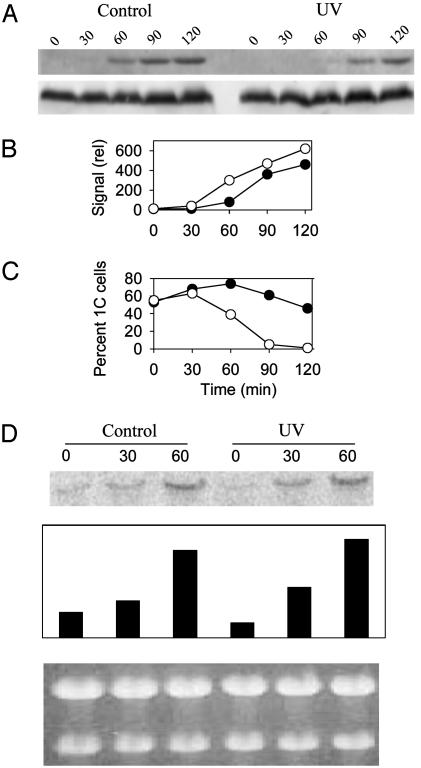
G1 is a crucial phase of cell growth because the decision to begin another mitotic cycle is made during this period. Occurrence of DNA damage in G1 poses a particular challenge, because replication of damaged DNA can be deleterious and because no sister chromatid is present to provide a template for recombinational repair. We therefore have studied the response of Schizosaccharomyces pombe cells to UV irradiation in early G1 phase. We find that irradiation results in delayed progression through G1, as manifested most critically in the delayed formation of the pre-replication complex. This delay does not have the molecular hallmarks of known checkpoint responses: it is independent of the checkpoint proteins Rad3, Cds1, and Chk1 and does not elicit inhibitory phosphorylation of Cdc2. Irradiated cells eventually progress into S phase and arrest in early S by a rad3- and cds1-dependent mechanism, most likely the intra-S checkpoint. Caffeine alleviates both the intra-G1- and intra-S-phase delays. We suggest that intra-G1 delay may be widely conserved and discuss significance and possible mechanisms.
Figures


Similar articles
-
Germinating fission yeast spores delay in G1 in response to UV irradiation.BMC Cell Biol. 2004 Oct 21;5(1):40. doi: 10.1186/1471-2121-5-40. BMC Cell Biol. 2004. PMID: 15498101 Free PMC article.
-
The Schizosaccharomyces pombe S-phase checkpoint differentiates between different types of DNA damage.Genetics. 1998 Aug;149(4):1729-37. doi: 10.1093/genetics/149.4.1729. Genetics. 1998. PMID: 9691032 Free PMC article.
-
Analysis of Rad3 and Chk1 protein kinases defines different checkpoint responses.EMBO J. 1998 Dec 15;17(24):7239-49. doi: 10.1093/emboj/17.24.7239. EMBO J. 1998. PMID: 9857181 Free PMC article.
-
A Rad3-Rad26 complex responds to DNA damage independently of other checkpoint proteins.Nat Cell Biol. 1999 Nov;1(7):393-8. doi: 10.1038/15623. Nat Cell Biol. 1999. PMID: 10559981
-
Regulation of initiation of S phase, replication checkpoint signaling, and maintenance of mitotic chromosome structures during S phase by Hsk1 kinase in the fission yeast.Mol Biol Cell. 2001 May;12(5):1257-74. doi: 10.1091/mbc.12.5.1257. Mol Biol Cell. 2001. PMID: 11359920 Free PMC article.
Cited by
-
Smc5-Smc6-dependent removal of cohesin from mitotic chromosomes.Mol Cell Biol. 2009 Aug;29(16):4363-75. doi: 10.1128/MCB.00377-09. Epub 2009 Jun 15. Mol Cell Biol. 2009. PMID: 19528228 Free PMC article.
-
DNA damage induces Cdt1 proteolysis in fission yeast through a pathway dependent on Cdt2 and Ddb1.EMBO Rep. 2006 Nov;7(11):1134-9. doi: 10.1038/sj.embor.7400827. Epub 2006 Oct 13. EMBO Rep. 2006. PMID: 17039252 Free PMC article.
-
Germinating fission yeast spores delay in G1 in response to UV irradiation.BMC Cell Biol. 2004 Oct 21;5(1):40. doi: 10.1186/1471-2121-5-40. BMC Cell Biol. 2004. PMID: 15498101 Free PMC article.
-
Cell-cycle analyses using thymidine analogues in fission yeast.PLoS One. 2014 Feb 13;9(2):e88629. doi: 10.1371/journal.pone.0088629. eCollection 2014. PLoS One. 2014. PMID: 24551125 Free PMC article.
-
Hpz1 modulates the G1-S transition in fission yeast.PLoS One. 2012;7(9):e44539. doi: 10.1371/journal.pone.0044539. Epub 2012 Sep 6. PLoS One. 2012. PMID: 22970243 Free PMC article.
References
Publication types
MeSH terms
Substances
LinkOut - more resources
Full Text Sources
Molecular Biology Databases
Miscellaneous
