

A quantitative characterization of the yeast heterotrimeric G protein cycle
- PMID: 12960402
- PMCID: PMC196877
- DOI: 10.1073/pnas.1834247100
A quantitative characterization of the yeast heterotrimeric G protein cycle
Abstract
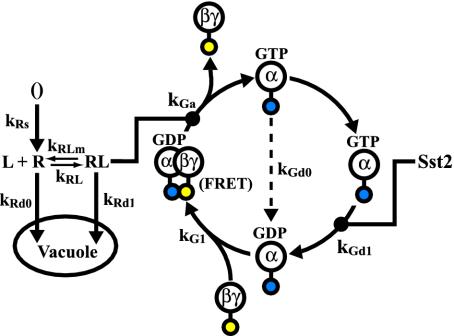
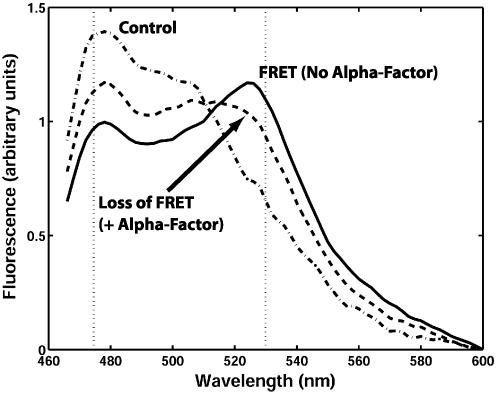
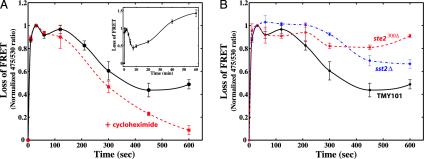
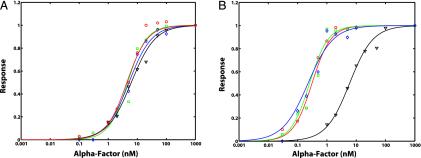
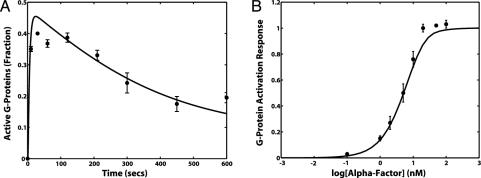
The yeast mating response is one of the best understood heterotrimeric G protein signaling pathways. Yet, most descriptions of this system have been qualitative. We have quantitatively characterized the heterotrimeric G protein cycle in yeast based on direct in vivo measurements. We used fluorescence resonance energy transfer to monitor the association state of cyan fluorescent protein (CFP)-Galpha and Gbetagamma-yellow fluorescent protein (YFP), and we found that receptor-mediated G protein activation produced a loss of fluorescence resonance energy transfer. Quantitative time course and dose-response data were obtained for both wild-type and mutant cells possessing an altered pheromone response. These results paint a quantitative portrait of how regulators such as Sst2p and the C-terminal tail of alpha-factor receptor modulate the kinetics and sensitivity of G protein signaling. We have explored critical features of the dynamics including the rapid rise and subsequent decline of active G proteins during the early response, and the relationship between the G protein activation dose-response curve and the downstream dose-response curves for cell-cycle arrest and transcriptional induction. Fitting the data to a mathematical model produced estimates of the in vivo rates of heterotrimeric G protein activation and deactivation in yeast.
Figures
Similar articles
-
The C-terminal tail preceding the CAAX box of a yeast G protein gamma subunit is dispensable for receptor-mediated G protein activation in vivo.J Biol Chem. 2003 Jun 6;278(23):20638-44. doi: 10.1074/jbc.M212701200. Epub 2003 Mar 28. J Biol Chem. 2003. PMID: 12665529
-
Distinct roles for two Galpha-Gbeta interfaces in cell polarity control by a yeast heterotrimeric G protein.Mol Biol Cell. 2008 Jan;19(1):181-97. doi: 10.1091/mbc.e07-04-0385. Epub 2007 Oct 31. Mol Biol Cell. 2008. PMID: 17978098 Free PMC article.
-
Signal transduction by a nondissociable heterotrimeric yeast G protein.Proc Natl Acad Sci U S A. 2000 Mar 28;97(7):3219-23. doi: 10.1073/pnas.97.7.3219. Proc Natl Acad Sci U S A. 2000. PMID: 10725354 Free PMC article.
-
Receptor-independent activators of heterotrimeric G-proteins.Life Sci. 2001 Apr 6;68(19-20):2301-8. doi: 10.1016/s0024-3205(01)01019-0. Life Sci. 2001. PMID: 11358340 Review.
-
Heterotrimeric G Protein-coupled Receptor Signaling in Yeast Mating Pheromone Response.J Biol Chem. 2016 Apr 8;291(15):7788-95. doi: 10.1074/jbc.R116.714980. Epub 2016 Feb 23. J Biol Chem. 2016. PMID: 26907689 Free PMC article. Review.
Cited by
-
Reshaping the yeast galactose regulon via GPCR signaling cascade.Cell Rep Methods. 2023 Dec 18;3(12):100647. doi: 10.1016/j.crmeth.2023.100647. Epub 2023 Nov 20. Cell Rep Methods. 2023. PMID: 37989311 Free PMC article.
-
Both ligand- and cell-specific parameters control ligand agonism in a kinetic model of g protein-coupled receptor signaling.PLoS Comput Biol. 2007 Jan 12;3(1):e6. doi: 10.1371/journal.pcbi.0030006. PLoS Comput Biol. 2007. PMID: 17222056 Free PMC article.
-
Gialpha and Gbeta subunits both define selectivity of G protein activation by alpha2-adrenergic receptors.Proc Natl Acad Sci U S A. 2006 Jan 3;103(1):212-7. doi: 10.1073/pnas.0509763102. Epub 2005 Dec 21. Proc Natl Acad Sci U S A. 2006. PMID: 16371464 Free PMC article.
-
A framework for discrete stochastic simulation on 3D moving boundary domains.J Chem Phys. 2016 Nov 14;145(18):184113. doi: 10.1063/1.4967338. J Chem Phys. 2016. PMID: 27846706 Free PMC article.
-
Modeling species-specific diacylglycerol dynamics in the RAW 264.7 macrophage.J Theor Biol. 2010 Feb 21;262(4):679-90. doi: 10.1016/j.jtbi.2009.10.030. Epub 2009 Oct 31. J Theor Biol. 2010. PMID: 19883664 Free PMC article.
References
-
- Hardman, J. G. & Limbird, L. E. (1996) Goodman & Gilman's The Pharma-cological Basis of Therapeutics, ed. Gilman, A. G. (McGraw–Hill, New York).
-
- Sprague, G. F., Jr., & Thorner, J. W. (1992) in The Molecular and Cellular Biology of the Yeast Saccharomyces: Gene Expression (Cold Spring Harbor Lab. Press, Plainview, NY), Vol. 2, pp. 657–744.
-
- Dohlman, H. G. & Thorner, J. W. (2001) Annu. Rev. Biochem. 70, 703–754. - PubMed
-
- Wieland, T. & Jakobs, K. H. (1994) Methods Enzymol. 237, 1–12. - PubMed
Publication types
MeSH terms
Substances
LinkOut - more resources
Full Text Sources
Other Literature Sources
Molecular Biology Databases
Miscellaneous
