. 2003 Sep 16;100(19):10740-5.
doi: 10.1073/pnas.1834348100. Epub 2003 Sep 5.

Pyk2 regulates multiple signaling events crucial for macrophage morphology and migration

Affiliations

Pyk2 regulates multiple signaling events crucial for macrophage morphology and migration

M Okigaki et al. Proc Natl Acad Sci U S A. .

Abstract

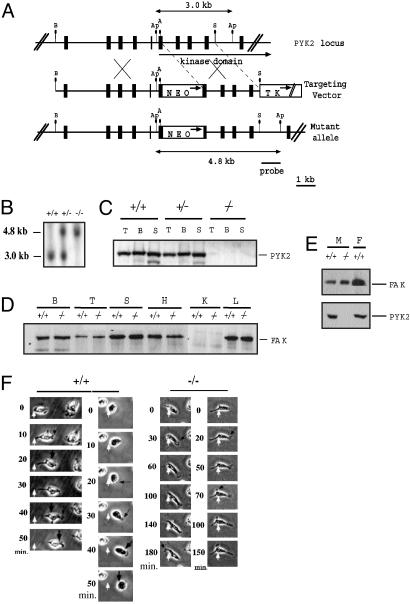
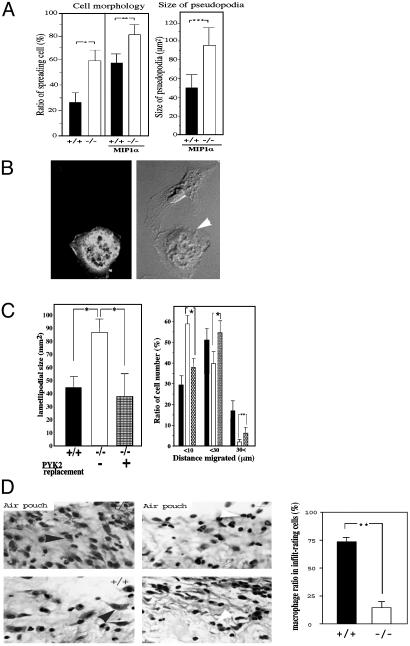
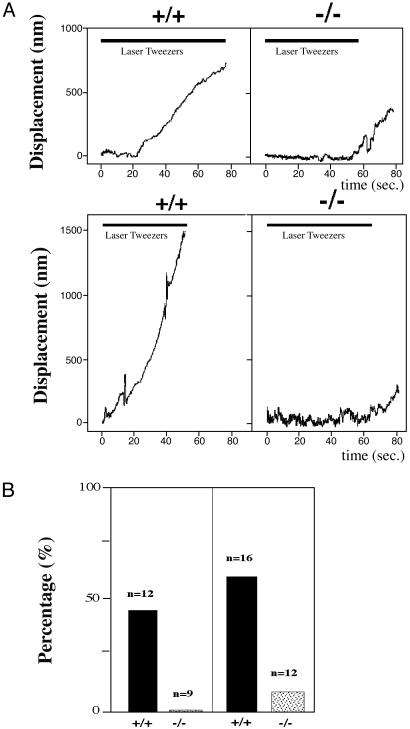
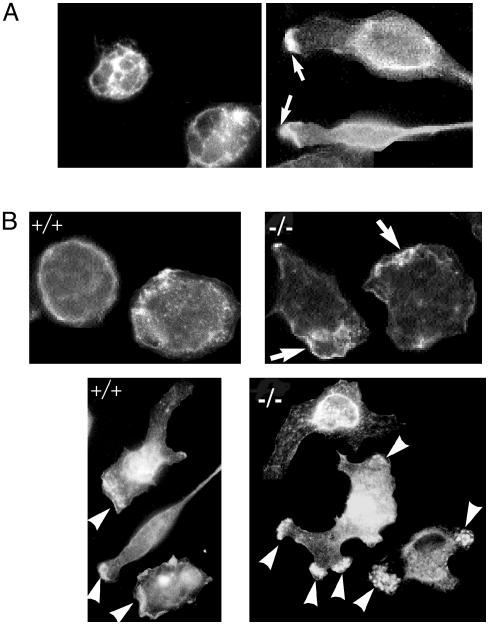
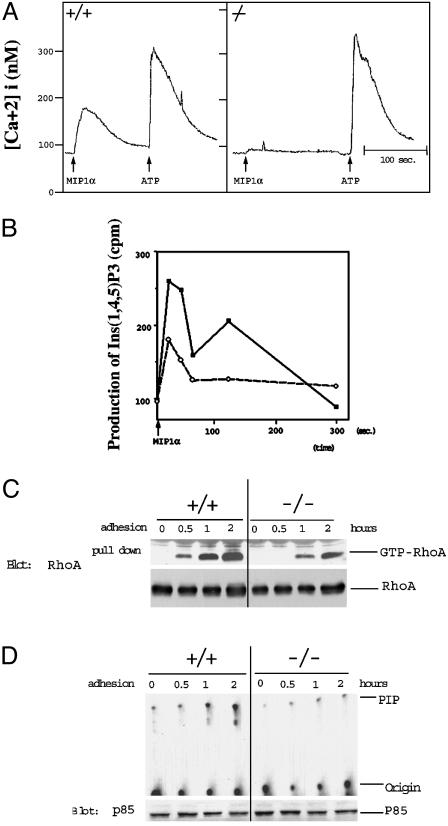
The biological role of the protein tyrosine kinase, Pyk2, was explored by targeting the Pyk2 gene by homologous recombination. Pyk2-/- mice are viable and fertile, without overt impairment in development or behavior. However, the morphology and behavior of Pyk2-/- macrophages were impaired. Macrophages isolated from mutant mice failed to become polarized, to undergo membrane ruffling, and to migrate in response to chemokine stimulation. Moreover, the contractile activity in the lamellipodia of Pyk2-/- macrophages was impaired, as revealed by measuring the rearward movement toward the nucleus of fibronectin-coated beads on the lamellipodia in opposition to an immobilizing force generated by optical tweezers. Consistently, the infiltration of macrophages into a carageenan-induced inflammatory region was strongly inhibited in Pyk2-/- mice. In addition, chemokine stimulation of inositol (1, 4, 5) triphosphate production and Ca2+ release, as well as integrin-induced activation of Rho and phosphatidyl inositol 3 kinase, were compromised in Pyk2-/- macrophages. These experiments reveal a role for Pyk2 in cell signaling in macrophages essential for cell migration and function.


Figures

Fig. 1.
Fig. 1.
Generation of Pyk2 knockout mice. (A) Schematic diagrams and partial restriction maps of Pyk2 locus, the Pyk2 targeting vector, and the predicted structure of the Pyk2 locus after homologous recombination with targeting vector. The filled box represents Pyk2 coding sequence, the bar is the 0.8-kb SacI–ApaI flanking probe used to identify the targeted Pyk2 locus, the open box indicates the PGK–Neo expression cassette and PGK–TK expression cassette. The arrows in open box indicate the direction of transcription. A, Ap, B, and S represent AccI, ApaI, BamHI, and SacI, respectively. (B) Autoradiogram of Southern blot analysis of tail DNA from F2 progeny. Genomic DNA was digested with ApaI and hybridized with the radiolabeled probe shown in A. +/+, +/–, and –/– denote DNA from wild-type, heterozygous, and homozygous F2 littermates, respectively. (C) Immunoblot analysis of tissue lysates. Lysates from thymus, brain, and spleen were subjected to immunoprecipitation with Pyk2 antibodies followed by immunoblotting with Pyk2 antibodies. T, B, and S represent thymus, brain, and spleen, respectively. (D) Immunoblot analysis of FAK expression in tissues from wild-type or Pyk2–/– mice. B, brain; T, thymus; S, spleen; H, heart; K, kidney; L, lung. (E) Immunoblot analysis of FAK or Pyk2 expression in macrophages (M) or fibroblasts (F) isolated from wild-type or Pyk2–/– mice. (F) Migration of wild-type or Pyk2–/– macrophages in response to SDF1α stimulation. White arrows mark the initial location of the cell, large black arrows mark cell contraction, and small black arrows mark lamellipodia.
Fig. 2.
Fig. 2.
Quantitation of impaired cell migration and altered cell morphology of Pyk2–/– macrophages. (A) Quantitative analysis of cell morphology (Left) and size of lamellipodia (Right). Wild-type or Pyk2–/– macrophages were plated on tissue culture dishes, and 200 cells in each genotype were categorized by their morphology and ability to spread and produce cell processes. Macrophage images were captured by using a charge-coupled device camera equipped on an inverted microscope. The size of lamellipodia was measured by NIH image software. Mean values and standard deviation of three experiments are presented. (B) Morphology of Pyk2–/– macrophage ectopically expressing Pyk2-GFP (Left). The morphology of macrophage expressing Pyk2-GFP (Right, white arrow) is similar to the morphology of wild-type macrophages. (C) Rescue of lamellipodia size and migration upon ectopic expression of Pyk2-GFP in Pyk2–/– macrophages. Quantitative analysis of the size of lamellipodia in wild-type (filled bar), Pyk2–/– (open bar), or Pyk2–/– macrophages expressing Pyk2-GFP. Quantitative analysis of cell migration (distance migrated in μM) of wild-type (filled bar), Pyk2–/– (open bar), or Pyk2–/– macrophages expressing GFP-Pyk2 (Right). *, P < 0.05. (D) Carageenen was applied into an air pouch generated under the skin of three wild-type or Pyk2–/– mice. The inflammatory region surrounding the air pouch was fixed and stained by hematoxylin and eosin. Black arrowheads mark representative macrophages and white arrowheads mark representative polymorphic neutrophils. Exude in the air pouch of wild-type or Pyk2–/– mice was recovered, and ratios of number of macrophages over a total of 900 infiltrating cells in the inflammatory region surrounding the air pouch per each wild-type or Pyk2–/– mouse were scored. (Right) Mean values and standard deviations from three wild-type and three Pyk2–/– mice are presented. Statistical analyses were done by unpaired t test. **, Analyzed groups with P < 0.01. Experiments were repeated twice with similar results.
Fig. 3.
Fig. 3.
Measurement of contractile capacity of lamellipodia in wild-type or Pyk2–/– macrophages by laser tweezers. (A) Plots of bead displacement from leading edge as a function of time. Fibronectin-coated beads were positioned with tweezers on the lamellipodia of Pyk2–/– or wild-type macrophages of unstimulated (Upper) or MIP1α-stimulated (Lower) cells near the leading edge at time 0. The trap remained on for ≈60 sec, as indicated by shaded area. (Upper) Bead displacement on nonstimulated macrophages. (Lower) Displacement on MIP1α-stimulated macrophages. (B) Histogram of ratio (%) of beads displaying escape from trapped field by laser tweezers. All of the beads on the lamellipodia of Pyk2–/– or wild-type macrophages before and after MIP1α stimulation were subjected to a restraining force after initial bead– cell contact for 60 sec. Ratios of beads that escaped and moved rearward were scored. (Left) Score of nonstimulated macrophages. (Right) Score of MIP1α-stimulated macrophages.
Fig. 4.
Fig. 4.
Pyk2 and F-actin localization in response to chemokine stimulation. (A) Unstimulated or MIP1α stimulated cells were fixed, permeabolized, labeled with anti-Pyk2 antibodies, followed by labeling with fluorescently conjugated anti-rabbit antibodies. In addition to membrane and cytoplasmic localization, Pyk2 is localized in the leading edge of stimulated cells pointing toward the chemokine gradient. Arrows mark the leading edge. (B) Altered F-actin localization in Pyk2–/– macrophages. Wild-type or Pyk2–/– macrophage were plated on cover glasses, fixed by 4% paraformaldehyde, and stained with fluorescently labeled phalloidin. (Upper) F-actin distribution in unstimulated wild-type or Pyk2–/– macrophages. (Lower) F-actin distribution after stimulation under MIP1α gradient concentration. The bottom left part of the field was exposed to the highest concentration of MIP1α. White arrows mark regions with strong F-actin staining.
Fig. 5.
Fig. 5.
Impaired cellular signaling in Pyk2–/– macrophages. (A) Single cell measurements of Ca2+ release of Fura-2 loaded wild-type or Pyk2–/– macrophages in Ringer's solution containing 2 mM calcium. Changes in fluorescence intensity as a function of time were monitored in response to MIP1α or ATP stimulation. Similar traces were obtained in >30 recordings of different cells. (B) Production of Ins(1,4,5)P3 in wild-type or Pyk2–/– macrophages. Wild-type or Pyk2–/– macrophages were labeled with myo-[3H]inositol for 24 h. After MIP1α stimulation, the lipid fraction was extracted and analyzed by HPLC. Filled squares indicate production of Ins(1,4,5)P3 in wild-type macrophages, and open circles indicate production of Ins(1,4,5)P3 in Pyk2–/– macrophages. The experiment shows mean values of [3H]Ins(1, 4, 5)P3 produced in duplicate samples. This experiment was repeated three times with similar results. (C) Reduced integrin-induced Rho activation in Pyk2-null macrophages. Wild-type or Pyk2–/– macrophages were plated on fibronectin-coated dishes for 30 min, 1 h, or 2 h incubation. Lysates from unstimulated or stimulated cells were treated with GST-RBD (Rho-binding domain) bound to glutathione beads as described in Materials and Methods. The amount of RhoA:GTP complex was determined by immunoblotting with anti-RhoA antibodies. (D) Integrin-stimulation of PI-3 kinase activity is compromised in Pyk2-null macrophages. Cell lysates were immunoprecipitated with anti-p85 antibodies followed by measurement of activity of PI-3 kinase as described (42).

References

    1. Lev, S., Moreno, H., Martinez, R., Canoll, P., Peles, E., Musacchio, J. M., Plowman, G. D., Rudy, B. & Schlessinger, J. (1995) Nature 376, 737–745. - PubMed
    1. Avraham, S., London, R., Fu, Y., Ota, S., Hiregowdara, D., Li, J., Jiang, S., Pasztor, L. M., White, R. A., Groopman, J. E. & Avraham, H. (1995) J. Biol. Chem. 270, 27742–27751. - PubMed
    1. Sasaki, H., Nagura, K., Ishino, M., Tobioka, H., Kotani, K. & Sasaki, T. (1995) J. Biol. Chem. 270, 21206–21219. - PubMed
    1. Yu, H., Li, X., Marchetto, G. S., Dy, R., Hunter, D., Calvo, B., Dawson, T. L., Wilm, M., Anderegg, R. J., Graves, L. M. & Earp, H. S. (1996) J. Biol. Chem. 271, 29993–29998. - PubMed
    1. Girault, J. A., Costa, A., Derkinderen, P., Studler, J. M. & Toutant, M. (1999) Trends Neurosci. 22, 257–263. - PubMed

MeSH terms