. 2003 Dec;14(12):5038-50.
doi: 10.1091/mbc.e03-06-0383. Epub 2003 Sep 5.

The angiotensin II type I receptor-associated protein, ATRAP, is a transmembrane protein and a modulator of angiotensin II signaling

Affiliations

The angiotensin II type I receptor-associated protein, ATRAP, is a transmembrane protein and a modulator of angiotensin II signaling

Marco Lopez-Ilasaca et al. Mol Biol Cell. 2003 Dec.

Abstract

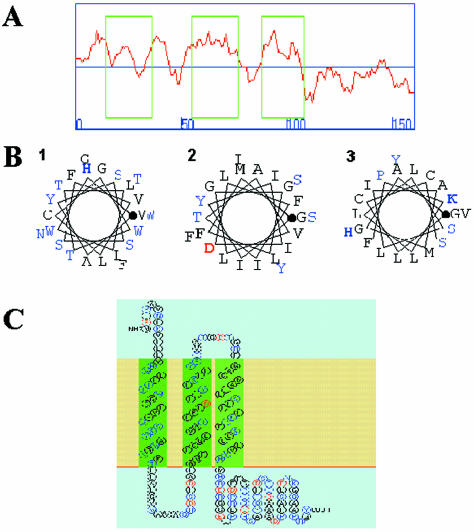
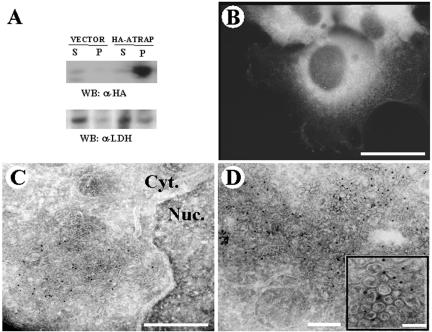
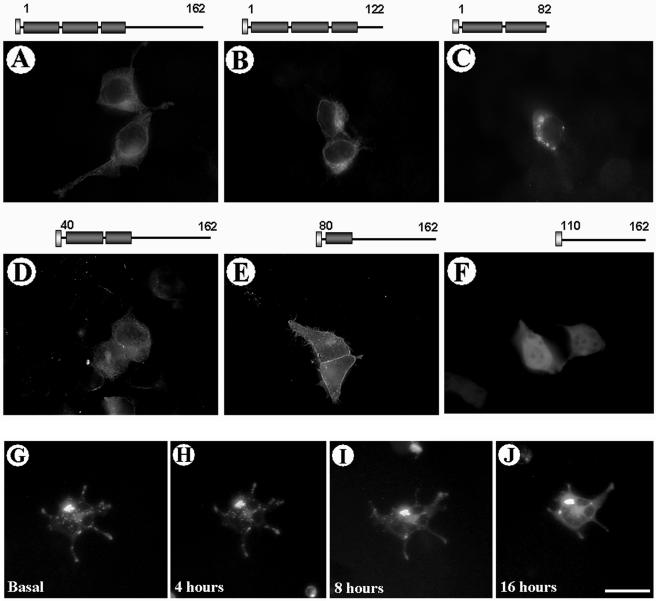
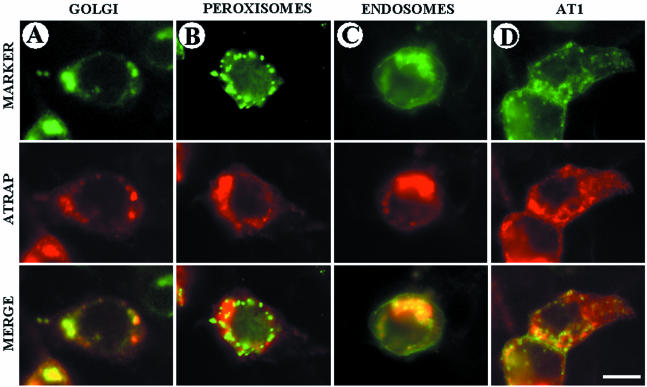
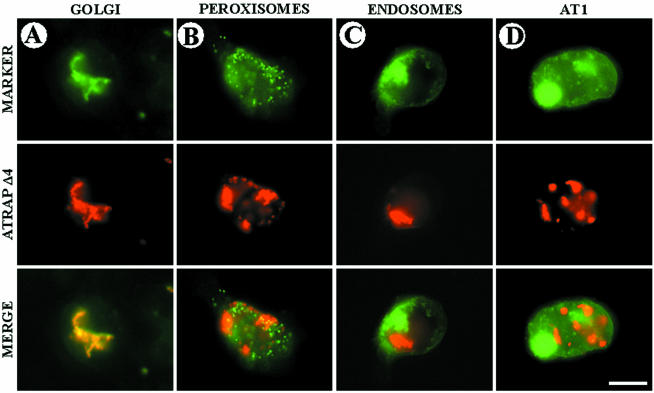
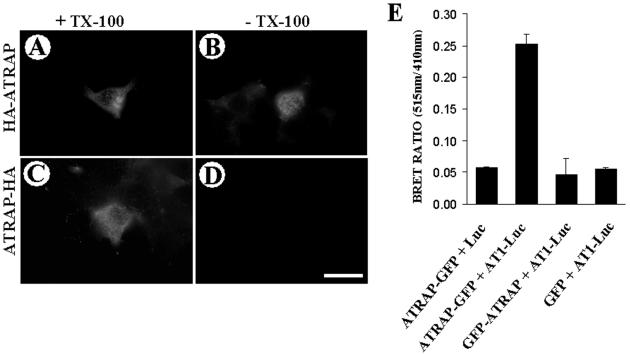
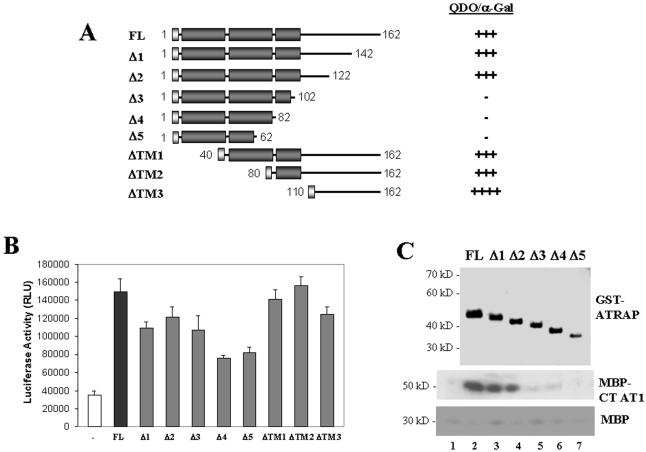
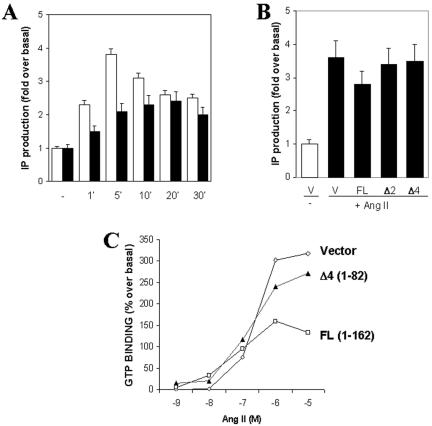
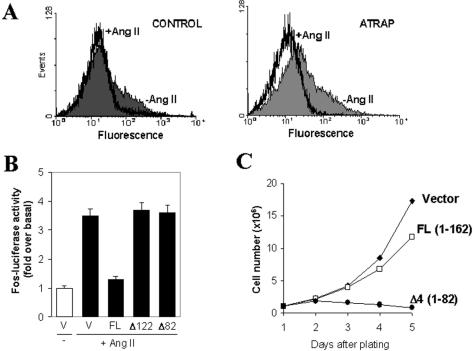
Our group identified angiotensin II type 1 (AT1) receptor-associated protein (ATRAP) in a yeast two-hybrid screen for proteins that bind to the carboxyl-terminal cytoplasmic domain of the AT1. In this work, we characterize ATRAP as a transmembrane protein localized in intracellular trafficking vesicles and plasma membrane that functions as a modulator of angiotensin II-induced signal transduction. ATRAP contains three hydrophobic domains at the amino-terminal end of the protein, encompassing the amino acid residues 14-36, 55-77, and 88-108 and a hydrophilic cytoplasmic carboxyl-terminal tail from residues 109-161. Endogenous and transfected ATRAP cDNA shows a particulate distribution; electron microscopy reveals the presence of ATRAP in prominent perinuclear vesicular membranes; and colocalization analysis by immunofluorescence shows that ATRAP colocalizes in an intracellular vesicular compartment corresponding to endoplasmic reticulum, Golgi, and endocytic vesicles. Real-time tracking of ATRAP vesicles shows constitutive translocation toward the plasma membrane. Using epitope-tagged forms of ATRAP at either the amino or carboxyl end of the molecule, we determined the orientation of the amino end as being outside the cell. Mutant forms of ATRAP lacking the carboxyl end are unable to bind to the AT1 receptor, leading to the formation of prominent perinuclear vesicle clusters. Functional analysis of the effects of ATRAP on angiotensin II-induced AT1 receptor signaling reveals a moderate decrease in the generation of inositol lipids, a marked decrease in the angiotensin II-stimulated transcriptional activity of the c-fos promoter luciferase reporter gene, and a decrease in cell proliferation.


Figures

Figure 1.
Figure 1.
Predicted structural organization of ATRAP. (A) Hydrophobicity plot with the SOSUI program showing three boxed hydrophobic regions in the N-terminal end of ATRAP comprising the amino acid residues 14–36, 55–77, and 88–108 and a hydrophilic region from residues 109–161. (B) α-Helix conformation of the hydrophobic segments with the hydrophobic residues is shown in black; the polar residues, in blue; positively charged residues, in bold blue; and negatively charged residues, in bold red; the initial residue for the helix is marked with a bold dot. Numbers indicate the putative transmembrane domains. (C) Proposed structure of ATRAP showing the two first transmembrane domains in green as “primary” hydrophobic domains and the third transmembrane domain in light green as a “secondary” hydrophobic domain.
Figure 2.
Figure 2.
Detergent insolubility, immunofluorescence, and electron microscopy of HEK-293 cells expressing ATRAP. (A) HEK-293 cells were transiently transfected with HA-ATRAP or empty vector. Western blots were performed using monoclonal antibodies to HA-epitope tag. (B) Endogenous ATRAP in HEK-293 cells was stained with polyclonal antibodies raised to the C-terminal region of ATRAP and observed by using Alexa-labeled secondary antibodies. Bar, 10 μm. (C and D) HEK-293 cells stably transfected with ATRAP-RFP were used for the electron microscopy studies and visualized with RFP polyclonal antibodies and 10-nm colloidal gold-conjugated secondary antibodies. Numerous gold beads labeled the vesicular structures, whereas no significant labeling was obtained on control cells or when anti-RFP serum was omitted. Bars (electron micrograph), 1 μm (C), 250 nm (D), and 100 nm (D, inset).
Figure 4.
Figure 4.
Expression of N-terminal and C-terminal deletion mutants of ATRAP. HEK-293 cells were transiently transfected with HAATRAP full length or the indicated mutants. After 48 h of expression, the cells were fixed in 4% PFA, stained with antibodies to HA, and detected by using Alexa-labeled secondary antibodies. The schematic diagram of the constructs is shown on the top of each image. The deletion of the C-terminal domain of ATRAP 1–82 aa, leads to the formation of prominent perinuclear vesicle clusters (C), whereas the deletion of the two first transmembrane domains leads to a sharp peripheral membrane localization of the protein (E). The deletion of the N-terminal domain containing the transmembrane domains leads to a diffuse cytoplasmic distribution of the protein (F). (G–J) Real-time tracking of ATRAP vesicles trafficking from the perinuclear compartment to the periphery of the cell. HEK-293 cells were transiently transfected with ATRAP-RFP; target cells were identified 24 h after plating in glass coverslips and followed in an inverted epifluorescence microscope for the indicated times. Bar, 30 μm.
Figure 3.
Figure 3.
Subcellular distribution of ATRAP in vesicular structures. The indicated fluorescent markers were cotransfected with full-length ATRAP-RFP in HEK-293 cells plated on glass coverslips. After 48 h of expression, the cells were fixed in PFA, washed, and mounted for microscope visualization. (A, C, and D) Colocalization of ATRAP with the Golgi marker vector encoding CFP-β-1,4-galactosyltransferase, the endosome marker encoding a fusion protein consisting of the human RhoB GTPase and the EGFP. FLAG-AT1 construct was visualized with polyclonal anti-FLAG antibodies and Alexa-goat anti-rabbit secondary antibodies. The EGFP-peroxisome marker vector (B) encodes a fusion protein consisting of the green fluorescent protein (EGFP) and the peroximal targeting signal 1 (PTS1). Bar, 20 μm.
Figure 5.
Figure 5.
Subcellular distribution of mutant ATRAP Δ4 (1–82 aa) in vesicular structures. The indicated fluorescent markers were cotransfected with mutant ATRAP-RFP in HEK-293 cells plated on glass coverslips. After 48 h of expression, the cells were fixed in PFA, washed, and mounted for microscope visualization. (A, C, and D) Colocalization of ATRAP with the Golgi marker vector encoding CFP-β-1,4-galactosyltransferase, the endosome marker encoding a fusion protein consisting of the human RhoB GTPase, and the EGFP. FLAG-AT1 construct was visualized with polyclonal anti-FLAG antibodies and Alexa goat anti-rabbit secondary antibodies. The EGFP-peroxisome marker vector (B) encodes a fusion protein consisting of EGFP and the peroximal targeting signal 1 (PTS1). Bar, 20 μm.
Figure 6.
Figure 6.
Determination of the orientation of the N-terminal end of ATRAP. (A–D) HEK-293 cells were transiently transfected with HA-ATRAP full-length tagged at either the N-terminal or C-terminal end and processed for immunofluorescence with or without Triton X-100 membrane solubilization after fixation. The HA-epitope tag located at the N-terminal end of ATRAP is accessible to the antibodies both in Triton X-100–permeabilized (A) and –nonpermeabilized cells (B); in contrast, cells expressing ATRAP with the epitope tag at the C-terminal end are accessible to the antibody only when the cells are permeabilized with detergent (C and D). Bar, 30 μm. (E) BRET assay showing that only ATRAP epitope tagged at its C-terminal end is able to give BRET a signal with AT1 receptor tagged with luciferase at the C-terminal tail. HEK-293 cells were transiently transfected with GFP and luciferase constructs at a ratio of 3:1. Forty-eight hours posttransfection, HEK-293 cells were detached with PBS/EDTA and washed twice in PBS. Approximately 50,000 cells/well were distributed in a 96-well microplate; the DeepBlue coelenterazine substrate was added at a final concentration of 5 μM, and readings were collected in a Victor2 microplate reader with filters at 410- and 515-nm wavelengths.
Figure 7.
Figure 7.
Domains of interaction of ATRAP with AT1. (A) Schematic representation of the yeast two-hybrid constructs used in the interaction assay with the C-terminal tail of AT1 receptor. The yeast reporter strain AH109 was cotransformed with the deleted versions of the ATRAP two-hybrid expression plasmid pGADT7 and the C-terminal tail of AT1 cloned in the two-hybrid expression plasmid pGBKT7. The cotransformants were selected in SD medium lacking leucine, tryptophan, histidine, and adenine (QDO). The yeast α-galactosidase activity was determined in plates containing X-α-Gal (2 mg/ml) as a chromogenic substrate. The strength of interaction was evaluated qualitatively as the intensity of the development of blue color in yeast colonies growing in selective medium. (B) Results of the mammalian two-hybrid analysis of ATRAP–AT1 interaction. HEK-293 cells were transiently transfected with the indicated deletion versions of ATRAP cloned in the target vector pCMV-NF-κB-AD together with the C-terminal end of AT1 cloned in the vector pCMV-GAL4-BD. Cells were lysed after 48 h of expression, and the luciferase activities were determined. (C) Coomassie Blue staining of the GST-fusion proteins purified from bacteria (top) and the results of the pulldown of the MBP fusion of AT1 (middle) or of MBP alone as a control (bottom). The lane number 1 shows the pulldown with GST alone.
Figure 8.
Figure 8.
Functional effects of the overexpression of ATRAP in Ang II-induced signaling. (A) Inositol phosphate production in CHO-K1 cells stably expressing AT1 receptors and transiently transfected with full-length ATRAP. Transfected cells were labeled overnight with myo-[3H]inositol in serum-free DMEM. After stimulation with Ang II 1 × 10⁶ M, cell lysates were extracted and separated on Dowex AG1-X8 columns. Bars in white are cells transfected with empty vector, and bars in black are cells transfected with ATRAP and treated with Ang II, 1 × 10⁶ M for the indicated times. (B) Inositol phosphate production in CHO-K1 cells transfected with deletion mutants of ATRAP after 5 min of treatment with Ang II 1 × 10⁶ M. (C) Determination of GTP-loading into membrane preparations of HEK-293 cells overexpressing AT1 receptors and the indicated ATRAP constructs. The determinations were performed using a time-resolved fluorescence protocol. Membrane preparations (10 μg) were incubated in the presence or absence of Ang II for 30 min; GTP-Eu (30 nM) was added for an additional 30 min before filtration, washing, and measurement at 615 nm on a microplate reader.
Figure 9.
Figure 9.
(A) Effect of ATRAP on internalization of AT1 receptor. HEK-293 cells stably expressing FLAG-epitope–tagged AT1 receptor and cotransfected with control vector (left) or full-length ATRAP (right) were stimulated with 1 × 10⁻⁶ M Ang II for 5 min and labeled with monoclonal antibodies specific to the FLAG epitope tag. Fluorescence analysis of 20,000 cells was performed in a fluorescence-activated cell sorting scan flow cytometer. (B) Fos-luciferase activity in CHO-K1 cells stably expressing AT1 receptors and transiently transfected with full-length ATRAP or the indicated deletion mutants and stimulated with Ang II 1 × 10⁶ M for 2 h. (B) Cell proliferation in HEK-293 cells stably transfected with ATRAP-RFP. After transfection and sorting, the cells were maintained in cell culture and subsequently plated in equal numbers (1 × 10⁶ cells/well) to respective plates; at each respective time cells were detached with PBS and counted in a hemocytometer.

Similar articles

Cited by

References

    1. Allen, A.M., Zhuo, J., and Mendelsohn, F.A. (2000). Localization and function of angiotensin AT1 receptors. Am. J. Hypertens. 13, 31S-38S. - PubMed
    1. Audoly, L.P., Oliverio, M.I., and Coffman, T.M. (2000). Insights into the functions of type 1 (AT1) angiotensin II receptors provided by gene targeting. Trends Endocrinol. Metab. 11, 263-269. - PubMed
    1. Blume, A., Herdegen, T., and Unger, T. (1999). Angiotensin peptides and inducible transcription factors. J. Mol. Med. 77, 339-357. - PubMed
    1. Brzostowski, J.A., and Kimmel, A.R. (2001). Signaling at zero G: G-protein-independent functions for 7-TM receptors. Trends Biochem. Sci. 26, 291-297. - PubMed
    1. Conchon, S., Barrault, M.B., Miserey, S., Corvol, P., and Clauser, E. (1997). The C-terminal third intracellular loop of the rat AT1 angiotensin II receptor plays a key role in G-protein coupling specificity and transduction of the mitogenic signal. J. Biol. Chem. 272, 25566-25572. - PubMed

Publication types

MeSH terms

LinkOut - more resources