. 2003 Nov;14(11):4365-75.
doi: 10.1091/mbc.e03-03-0169. Epub 2003 Sep 5.

Polarization of specific tropomyosin isoforms in gastrointestinal epithelial cells and their impact on CFTR at the apical surface

Affiliations

Polarization of specific tropomyosin isoforms in gastrointestinal epithelial cells and their impact on CFTR at the apical surface

Jacqueline Rae Dalby-Payne et al. Mol Biol Cell. 2003 Nov.

Abstract

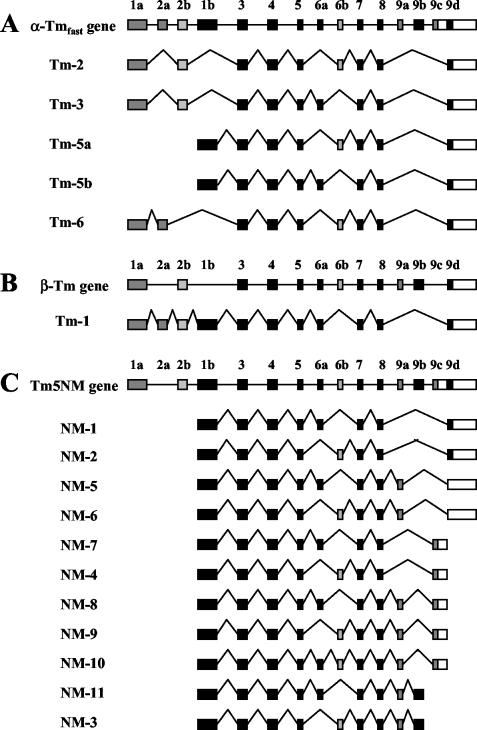
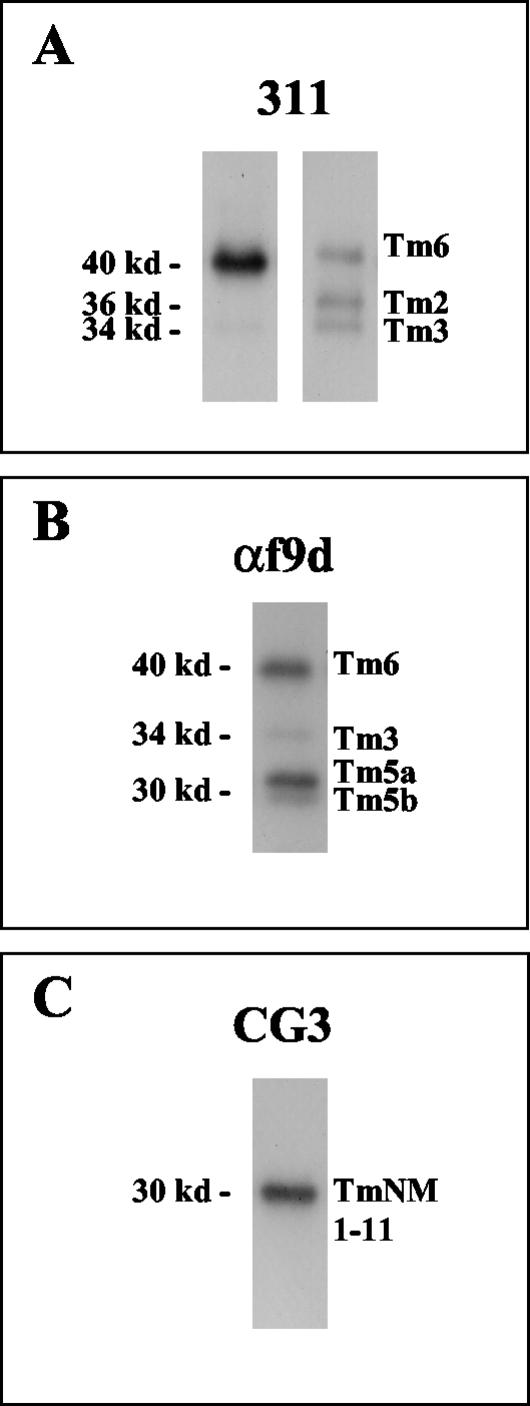
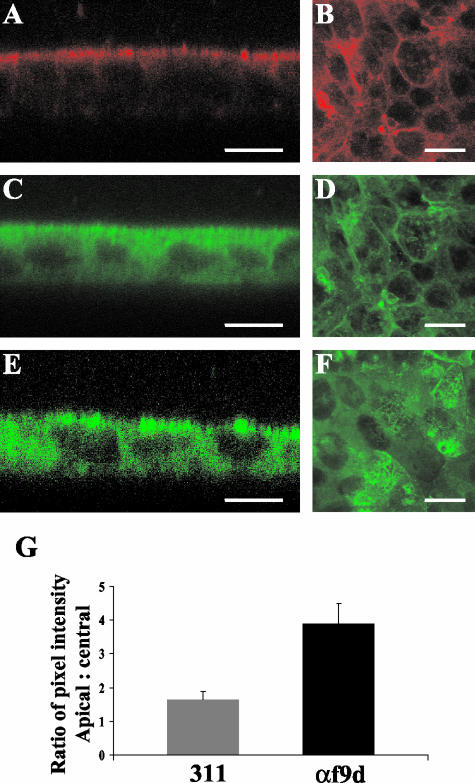
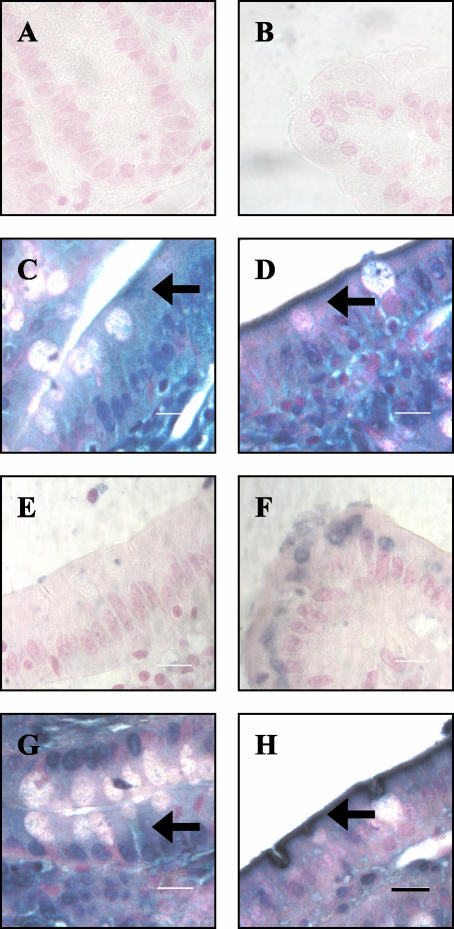
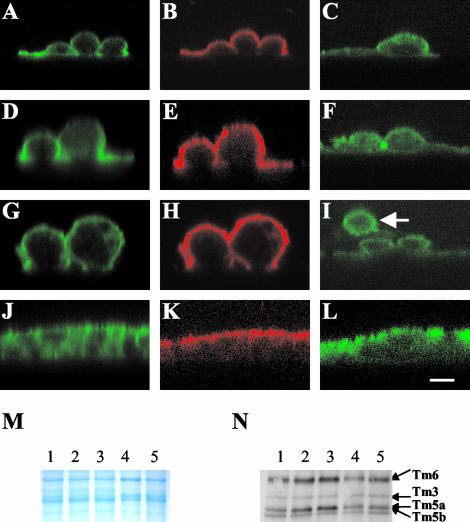
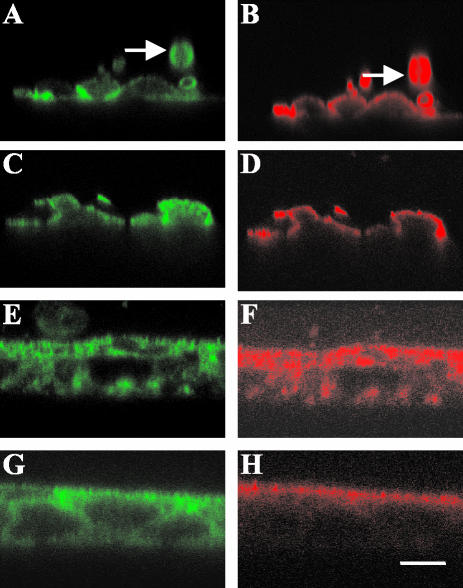
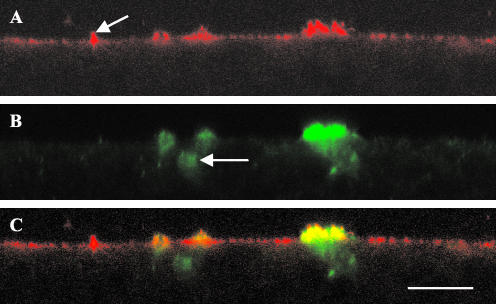
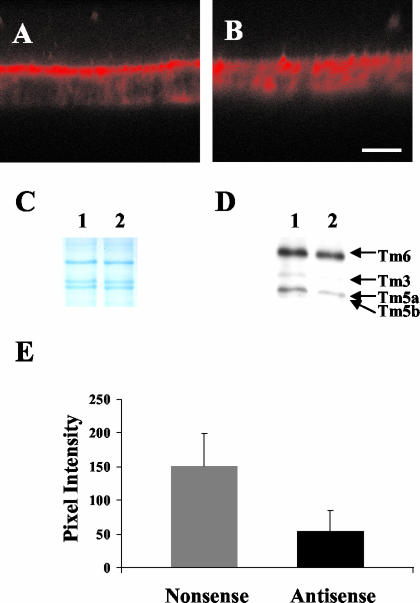
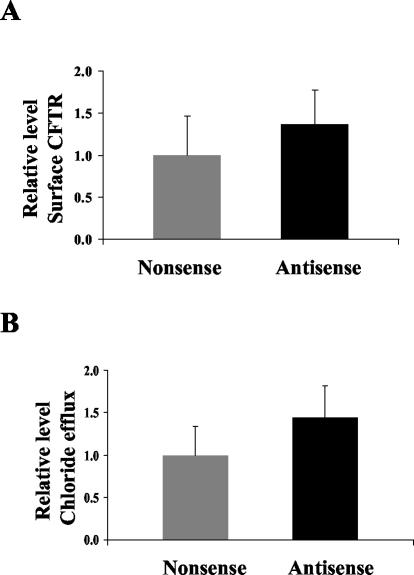
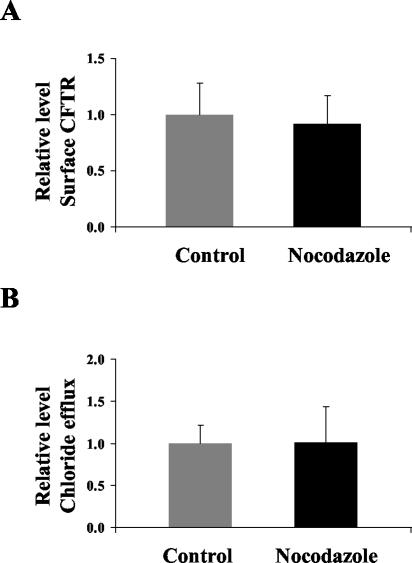
Microfilaments have been reported to be polarized in a number of cell types based both on function and isoform composition. There is evidence that microfilaments are involved in the movement of vesicles and the polarized delivery of proteins to specialized membrane domains. We have investigated the composition of actin microfilaments in gastrointestinal epithelial cells and their role in the delivery of the cystic fibrosis transmembrane conductance regulator (CFTR) into the apical membrane using cultured T84 cells as a model. We identified a specific population of microfilaments containing the tropomyosin (Tm) isoforms Tm5a and/or Tm5b, which are polarized in T84 cell monolayers. Polarization of this microfilament population occurs very rapidly in response to cell-cell and cell-substratum contact and is not inhibited by jasplakinolide, suggesting this involves the movement of intact filaments. Colocalization of Tm5a and/or Tm5b and CFTR was observed in long-term cultures. A reduction in Tm5a and Tm5b expression, induced using antisense oligonucleotides, resulted in an increase in both CFTR surface expression and chloride efflux in response to cAMP stimulation. We conclude that Tm isoforms Tm5a and/or Tm5b mark an apical population of microfilaments that can regulate the insertion and/or retention of CFTR into the plasma membrane.


Figures

Figure 1.
Figure 1.
Maps of three tropomyosin (Tm) genes and their nonmuscle, nonbrain product(s). Exons are shown as shaded boxes, the 3′ untranslated sequence as unshaded boxes and the introns are represented by lines. (A) The α gene (α-Tmf). Note that exon 1b is unique to Tm5a and Tm5b. (B) The β-Tm gene, (C) The γ gene (Tm5NM products). (Taken from Temm-Grove CJ et al., 1998 and Percival et al., 2000)
Figure 2.
Figure 2.
Tropomyosin antibody specificity. Tropomyosin antibody specificity in T84 cells and human fibroblasts are shown in Western blots. The specificities of 311 in T84 cells (left) and fibroblasts (right) are shown in A and the specificities of αf9d and CG3 antibodies are shown in B and C respectively. The 311 antibody detects Tm6 (40 kDa), Tm2 (36 kDa) and Tm3 (34 kDa) in human fibroblasts. Tm2 is absent and Tm3 is quite minor in T84 cells. Tm1 (36 kDa) was absent from both T84 cells and human fibroblasts (A). αf9d detects Tm6 (40 kDa), Tm3 (34 kDa), Tm5a (30 kDa) and Tm5b (30 kDa) in T84 cells (B). CG3 antibody detects 11 possible isoforms (Tm5NM1–11) that comigrate at 30 kDa and shows a single band in T84 cells composed of an unknown number of isoforms (C).
Figure 3.
Figure 3.
T84 cell monolayers express a polarized distribution of Tm5a and Tm5b. (A–F) Mature T84 cell monolayers were labeled with αf9d (A and B), 311 (C and D) and CG3 (E and F) antibodies. A-D is the same monolayer costained with αf9d and 311. The antibody distribution was analyzed by Confocal Laser Scanning Microscopy. Images in the vertical plane (xz) are shown on the left and images in the horizontal plane (xy) are shown on the right. The differential staining pattern between αf9d and 311 represents Tm5a and/or Tm5b. Bar, 10 μm. (G) The mean apical and central pixel intensity was measured across the apical and central region of the individual monolayers. The apical:central mean pixel intensity ratios for αf9d and 311 were compared in costained monolayers and are represented as the mean ± SD for each group. Results represent the average of 8 costained monolayers.
Figure 4.
Figure 4.
Localization of tropomyosin isoforms in the crypts and villi of the rat duodenum. Sections of rat duodenal tissue were fixed and stained with αf9d (C and D), 311 (E and F) and CG3 (G and H) antibodies. Sections through the crypts are on the left and sections through the villi are on the right. A and B represent antibody negative controls. Arrows indicate gastrointestinal epithelial cells. Immunoreactivity is indicated by the blue staining and slides were counterstained with Nuclear fast red. Bar, 10 μm.
Figure 5.
Figure 5.
The development of polarization of tropomyosin isoforms. (A-L) immunofluorescence confocal microscopy images of T84 cells stained for tropomyosin isoforms at various time points after seeding. All images are in the vertical (xz) plane. At each time point, the images on the left and in the center are of the same costained cells. On the left (A, D, G, and J) the 311 antibody (Tm 3, 6) staining is shown. In the center (B, E, H, and K) the αf9d antibody (Tm 3, 5a, 5b, 6) staining is shown. The cells on the right (C, F, I, L) are stained with CG3 antibody (TmNM1–11). (A, B, and C) 10 min; (D, E, and F) 1 h; (G, H, and I) 2 h; (J, K, and L) 24 h. The arrows indicates a T84 cell in suspension with circumferential staining. Bar, 10 μm. (M and N) Total protein and specific tropomyosin isoform expression during T84 cell monolayer development. Protein was extracted from T84 cells 1, 2, 4, and 24 h and 7 d after seeding. (M) Gel stained with Coomassie blue showing total protein. (N) Western blot immunoblotted with αf9d antibody (Tm 3, 5a, 5b, 6).
Figure 6.
Figure 6.
Localization of tropomyosin isoforms in T84 cells after treatment with jasplakinolide or nocodazole. Immunofluorescent confocal microscopy images of T84 cells stained for tropomyosin isoforms 10 min (A–D)or 7 d (E–H) after cell seeding. All images are in the vertical (xz) plane. Cells on the left (A, C, E, and G) are stained with 311 antibody (Tm 3,6) and cells on the right (B, D, F, and H) are stained with αf9d antibody (Tm 3, 5a, 5b, 6). (A and B) Cells treated with 1 μM jasplakinolide 10 min before plating. (C and D) Cells treated with 33 μM nocodazole 10 min before plating. (E and F) T84 cell monolayers treated with 20 μM cytochalasin D for 3 h. The arrows indicate a T84 cell in suspension with circumferential staining of both 311 and αf9d antibody. (G and H) T84 cell monolayers treated with DMSO alone. Bar, 10 μm.
Figure 7.
Figure 7.
immunofluorescence confocal microscopy images of T84 cell monolayers costained for tropomyosin isoforms and CFTR. All images are in the vertical plane. (A) αf9d antibody (Tm 3, 5a, 5b, and 6). The arrow indicates an area of enriched αf9d staining in the apical membrane not associated with CFTR; (B) CFTR antibody; (C) Overlay of image A and image B. Yellow highlights areas of colocalization. Bar, 10 μm.
Figure 8.
Figure 8.
Effect of antisense and nonsense oligonucleotides against Tm5a and Tm5b on the distribution of αf9d antibody staining in T84 cell monolayers. Immunofluorescent confocal microscopy images of T84 cell monolayers. Both images are in the vertical plane. Both monolayers have been stained with αf9d (Tm3, 5a, 5b, and 6). (A) Nonsense oligonucleotide 2 μM for 24 h; (B) Antisense oligonucleotide 2 μM for 24 h. Bar, 10 μm. (C and D) Western blot showing the effect of antisense and nonsense oligonucleotides against Tm5a and Tm5b on T84 cells. Protein was extracted from T84 cell monolayers following treatment with either 2 μM antisense or nonsense oligonucleotides against Tm5a and Tm5b for 24 h. (C) Gel stained with Coomassie blue showing total protein. (D) Western blot immunoblotted with the αf9d antibody (Tm3, 5a, 5b, and 6). (E) Effect of antisense and nonsense oligonucleotides against Tm5a and Tm5b on intensity of apical staining with αf9d antibody in T84 cell monolayers. The apical αf9d antibody staining pixel intensity was determined by confocal microscopy in T84 cell monolayers treated with either 2 μM antisense or nonsense oligonucleotides for 24 h. The area to be scanned was determined using the costained 311 image in order to maintain objectivity. All measurements were undertaken in the same session using identical confocal microscope intensity settings to allow comparison of absolute pixel intensity values. The mean ± 1SD for each group is depicted. (Nonsense 150.86 ± 48.28, Antisense 53.62 ± 31.62; p < 0.001)
Figure 9.
Figure 9.
Effect of antisense and nonsense oligonucleotides against Tm5a and Tm5b on cell surface expression of CFTR and chloride efflux in T84 cell monolayers. (A) Enzyme linked CFTR surface expression assays were performed on T84 cell monolayers treated with either 2 μM antisense or nonsense oligonucleotides for 24 h. CFTR expression is represented by absorbance at 655 nm, normalized to the mean absorbance of the nonsense treated group within individual experiments. Fourteen monolayers were examined in each group. The mean ± 1 SD for each group is depicted. (Nonsense 1 ± 0.42, Antisense 1.49 ± 0.78; p < 0.001). (B) MQAE chloride efflux assays were performed on T84 cell monolayers treated with either 2 μM antisense or nonsense oligonucleotides against Tm5a and Tm5b. Cumulative chloride efflux at 15 min is represented by the mean percentage increase in fluorescence from baseline, normalized to the mean percentage increase of the nonsense group, within individual experiments. Twenty nine monolayers were examined in each group. The mean ± 1 SD for each group is depicted. (Nonsense 1 ± 0.36, Antisense 1.47 ± 0.41; p < 0.001)
Figure 10.
Figure 10.
Effect of nocodazole treatment on cell surface expression of CFTR and chloride efflux in T84 cell monolayers. Enzyme linked CFTR surface expression assays were performed on forskolin stimulated T84 cell monolayers with and without treatment with 33 μM nocodazole for 3 h. CFTR expression is represented by absorbance at 655 nm, normalized to the mean absorbance of the control group within individual experiments. Six monolayers were examined in each group. The mean ± SD for each group is depicted. (Control 1.00 ± 0.29, Nocodazole 0.92 ± 0.25; p = 0.64). (B) MQAE chloride efflux assays were performed on control T84 cell monolayers and T84 cell monolayers treated with nocodazole 33 μM for 3 h. Cumulative chloride efflux at 15 min is represented by the mean percentage increase in fluorescence from baseline, normalized to the mean percentage increase of the control group, within individual experiments. Ten monolayers were examined in each group. The mean ± SD for each group is depicted. (Control 1.00 ± 0.22, Nocodazole 1.01 ± 0.43; p = 0.93)

Similar articles

Cited by

References

    1. Ameen, N.A., Ardito, T., Kashgarian, M., and Marino, C.R. (1995). A unique subset of rat and human intestinal villus cells express the cystic fibrosis transmembrane conductance regulator. Gastroenterology 108, 1016-1023. - PubMed
    1. Ameem. N.A., Martensson, B., Bourguinon, L., Marino, C., Isenberg, J., McLaughlin, G. E. CFTR. (1999). channel insertion to the apical surface in rat duodenal villus epithelial cells is upregulated by VIP in vivo. J. Cell Sci. 112, 887-894. - PubMed
    1. Bryce, N.S., et al. (2003). Specification of actin filament function and molecular composition by tropomyosin isoforms. Mol. Biol. Cell. 14, 1002-1016. - PMC - PubMed
    1. Chasan, B., Geisse, N.A., Pedatella, K. Wooster, D.G., Teintze, M., Carattino, M.D., Goldmann, W.H., Cantiello, H.F. (2002). Evidence for direct interaction between actin and the cystic fibrosis transmembrane conductance regulator. Eur. Biophys. J. 30, 617-624. - PubMed
    1. Drubin, D.G., and Nelson, W.J. (1996). Origins of cell polarity. Cell 84, 335-344. - PubMed

Publication types

MeSH terms

LinkOut - more resources