. 2003 Dec 1;553(Pt 2):665-79.
doi: 10.1113/jphysiol.2003.050153. Epub 2003 Sep 8.

Effect of transcranial magnetic stimulation on single-unit activity in the cat primary visual cortex

Affiliations

Effect of transcranial magnetic stimulation on single-unit activity in the cat primary visual cortex

Vera Moliadze et al. J Physiol. .

Abstract

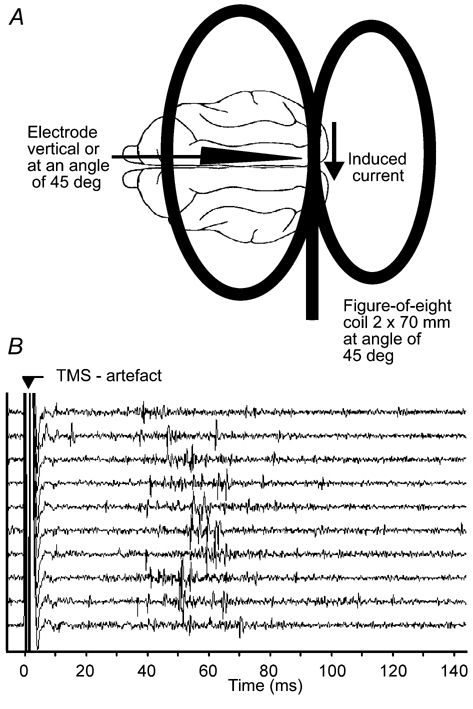
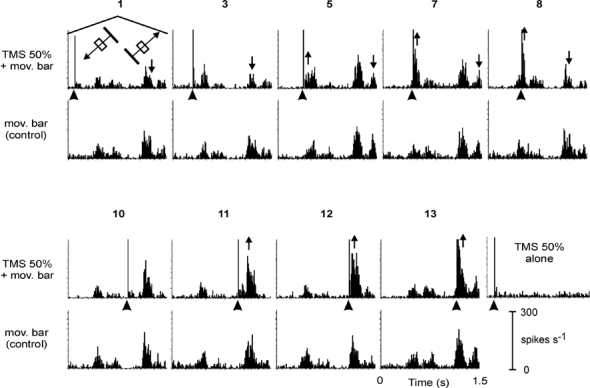
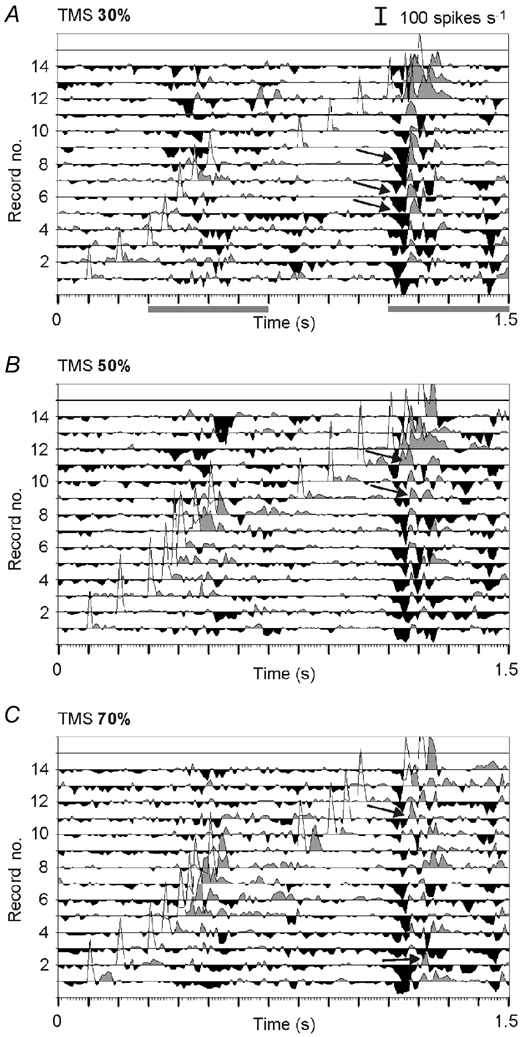
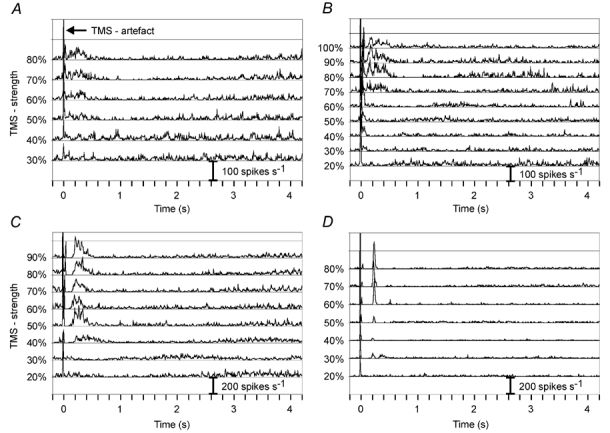
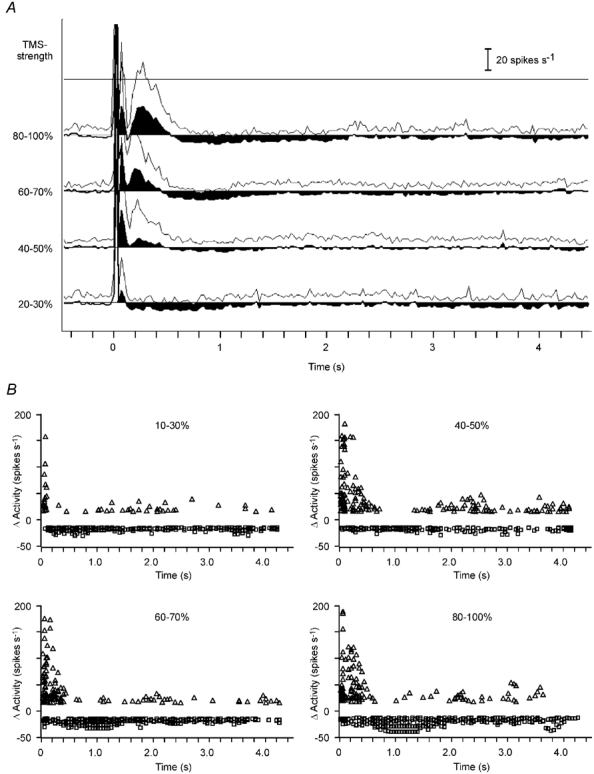
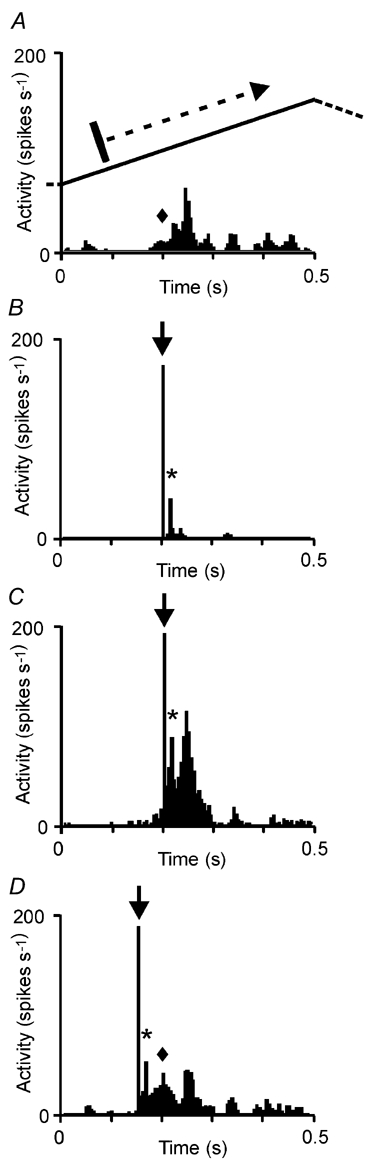
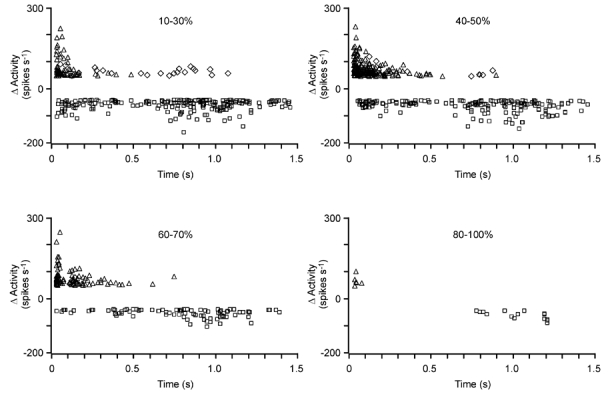
Transcranial magnetic stimulation (TMS) has become a well established procedure for testing and modulating the neuronal excitability of human brain areas, but relatively little is known about the cellular processes induced by this rather coarse stimulus. In a first attempt, we performed extracellular single-unit recordings in the primary visual cortex (area 17) of the anaesthetised and paralysed cat, with the stimulating magnetic field centred at the recording site (2 x 70 mm figure-of-eight coil). The effect of single biphasic TMS pulses, which induce a lateral-to-medial electric current within the occipital pole of the right hemisphere, was tested for spontaneous as well as visually evoked activity. For cat visual cortex we found that a single TMS pulse elicited distinct episodes of enhanced and suppressed activity: in general, a facilitation of activity was found during the first 500 ms, followed thereafter by a suppression of activity lasting up to a few seconds. Strong stimuli exceeding 50 % of maximal stimulator output could also lead to an early suppression of activity during the first 100-200 ms, followed by stronger (rebound) facilitation. Early suppression and facilitation of activity may be related to a more or less direct stimulation of inhibitory and excitatory interneurons, probably with different thresholds. The late, long-lasting suppression is more likely to be related to metabotropic or metabolic processes, or even vascular responses. The time course of facilitation/inhibition may provide clues regarding the action of repetitive TMS application.


Figures

Figure 1
Figure 1. Coil position and example of action potential recordings during TMS
A, sketch showing the position of the figure-of-eight coil (2 × 70 mm) relative to the cat's brain. The coil is tilted by 45 deg in an anterior-posterior direction and the junction of the two coils (where magnetic field is maximal) is placed above area 17/18 of the right hemisphere. Spikes were recorded from area 17 within the centre of the magnetic field. B, analog signal traces of 10 consecutive recordings showing the huge, but short electrical artefact produced by the TMS pulse and extracellularly recorded action potentials.
Figure 5
Figure 5. TMS pulses given at different times relative to the visual response
Subset of a series of measurements (nine out of 14) with the TMS pulse given at different times relative to the first and second visual response of a simple cell (depth 1867 µm) to a bright bar crossing its receptive field (mov. bar) in two, opposing directions. Upper rows: combined TMS (arrowheads) and visual stimulation; lower rows: visual stimulation alone (control). No additional activity was evoked by TMS alone (diagram to the right of the lower block). The numbers on top of the diagrams refer to the traces shown in Fig. 6B. Upward- or downward-directed arrows indicate an increase or decrease of visual activity, respectively.
Figure 6
Figure 6. Effect of TMS presented at different times and at different strengths on visual responses
Series of PSTHs showing changes in the visual response amplitude due to TMS pulses of different strengths (A, 30 %; B, 50 %; C, 70 %) applied at different times relative to the visual response (traces 1–14). The diagrams were obtained by subtracting the activity evoked by visual stimulation alone from the activity elicited by combined TMS and visual stimulation. The traces thus show the enhancement (grey areas) and reduction (black areas) of activity caused by the additional TMS (the artefacts appear as unfilled regions). Arrows point to a sequence of suppression and facilitation, possibly resembling a rebound phenomenon. All measurements were performed in the same cell; part of the original PSTHs are shown in Fig. 5. Grey bars below A label episodes of visual activity.
Figure 2
Figure 2. Effect of TMS pulses of different strengths on spontaneous or visually evoked activity
TMS was applied either during spontaneous activity (B-D) or during visually evoked activity by uncorrelated flicker of a bright bar (A). Data from two simple cells are shown in A and D, and from two complex cells in B and C. The cortical recording depths were 777 µm (A), 1100 µm (B), 1427 µm (C) and 185 µm (D). For further explanation see Results.
Figure 3
Figure 3. Grand average and statistics of TMS effect on spontaneous activity
A, grand average of records obtained with different TMS strengths during spontaneous activity. The mean level of spontaneous activity prior to TMS was set to zero to emphasise increases and decreases in activity (black filled areas). The thin line depicts the standard deviation. B, scatter plots showing the strength and time of increase (triangles) and decrease (squares) in activity relative to the pre-TMS level of spontaneous activity. A threshold was set at +15 and −15 spikes s−1, corresponding to two times the standard deviation of spontaneous activity. Data of the same records as those averaged in A are shown for different strengths of TMS pulse. PSTHs (A) and scatter plots (B) were obtained from 20 cells, in only 18 of which was a range of 80–100 % calculated. Total number of records analysed: 10–30 %, 36; 40–50 %, 36; 60–70 %, 37; 80–100 %, 32.
Figure 4
Figure 4. Effect of TMS on visual responses to moving bars
Visual response of a cortical neuron (simple cell) to a bar moving across its receptive field. For simplicity, only the response to one direction of bar motion is shown here (see inset of motion trajectory). A, visual stimulation alone. B, TMS alone. C and D, TMS combined with visual stimulation, with TMS given at two different times. Note that the activity evoked by TMS alone (asterisks) is less than the increase of visual activity during combined TMS and moving bar (see response components labelled with asterisks and diamonds). Arrows indicate the TMS artefact.
Figure 7
Figure 7. Statistics for the effect of TMS on the visual responses evoked by a moving bar stimulus
For individual measurements, the scatter plots show the strength and time of changes in activity elicited by single TMS pulses of different strengths (20–30 %: 39 cells, 290 records; 40–50 %: 48 cells, 256 records; 60–70 %: 28 cells, 99 records; 80–100 %: seven cells, 14 records). The time axis is aligned to TMS onset and the threshold for changes in activity was set to ± 50 spikes s−1. Facilitation following a suppression within 60 ms (rebound) is shown by diamonds. Facilitation missing a preceding suppression is shown with triangles. Squares are used to plot the suppression of activity.

Similar articles

Cited by

References

    1. Amassian VE, Eberle L, Maccabee PJ, Cracco RQ. Modelling magnetic coil excitation of human cerebral cortex with a peripheral nerve immersed in a brain-shaped volume conductor: the significance of fiber bending in excitation. Electroencephalogr Clin Neurophysiol. 1992;85:291–301. - PubMed
    1. Amassian VE, Steward M, Quirk GJ, Rosenthal JL. Physiological basis of motor effects of a transient stimulus to cerebral cortex. Neurosurgery. 1987;20:74–93. - PubMed
    1. Baker SN, Olivier E, Lemon RN. Recording an identified pyramidal volley evoked by transcranial magnetic stimulation in a conscious macaque monkey. Exp Brain Res. 1994;99:529–532. - PubMed
    1. Barker AT, Jalinous R, Freeston IL. Non-invasive magnetic stimulation of human motor cortex. Lancet. 1985;1:1106–1107. - PubMed
    1. Berardelli A, Inghilleri M, Rothwell JC, Romeo S, Curra A, Gilio F, Modugno N, Manfredi M. Facilitation of muscle evoked responses after repetitive cortical stimulation in man. Exp Brain Res. 1998;122:79–84. - PubMed

LinkOut - more resources