. 2003 Dec 1;553(Pt 2):415-26.
doi: 10.1113/jphysiol.2003.048371. Epub 2003 Sep 8.

Adenosine A(1) receptor-mediated presynaptic inhibition at the calyx of Held of immature rats

Affiliations

Adenosine A(1) receptor-mediated presynaptic inhibition at the calyx of Held of immature rats

Masahiro Kimura et al. J Physiol. .

Abstract

At the calyx of Held synapse in brainstem slices of 5- to 7-day-old (P5-7) rats, adenosine, or the type 1 adenosine (A1) receptor agonist N6-cyclopentyladenosine (CPA), inhibited excitatory postsynaptic currents (EPSCs) without affecting the amplitude of miniature EPSCs. The A1 receptor antagonist 8-cyclopentyltheophylline (CPT) had no effect on the amplitude of EPSCs evoked at a low frequency, but significantly reduced the magnitude of synaptic depression caused by repetitive stimulation at 10 Hz, suggesting that endogenous adenosine is involved in the regulation of transmitter release. Adenosine inhibited presynaptic Ca(2+) currents (IpCa) recorded directly from calyceal terminals, but had no effect on presynaptic K+ currents. When EPSCs were evoked by IpCa during simultaneous pre- and postsynaptic recordings, the magnitude of the adenosine-induced inhibition of IpCa fully explained that of EPSCs, suggesting that the presynaptic Ca(2+) channel is the main target of A1 receptors. Whereas the N-type Ca(2+) channel blocker omega-conotoxin attenuated EPSCs, it had no effect on the magnitude of adenosine-induced inhibition of EPSCs. During postnatal development, in parallel with a decrease in the A1 receptor immunoreactivity at the calyceal terminal, the inhibitory effect of adenosine became weaker. We conclude that presynaptic A1 receptors at the immature calyx of Held synapse play a regulatory role in transmitter release during high frequency transmission, by inhibiting multiple types of presynaptic Ca(2+) channels.


Figures
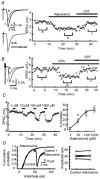
Figure 1
Figure 1. Inhibitory effect of adenosine on EPSCs mediated by A1 receptors in P5–7 rats
A, bath application of adenosine (100 µm) attenuated EPSCs (b). CPT (0.5 µm) reversed this adenosine effect (c). Sample records on the top are averaged EPSCs before (a) and during (b) adenosine application, and during addition of CPT (c, superimposed). Averaged EPSCs before (a) and after (b) adenosine application, when normalized in peak amplitude, completely overlapped with each other (bottom, superimposed). B, CPA (1 µm) attenuated EPSCs (b), and this effect was reversed by CPT (0.5 µm, c). C, adenosine inhibits EPSCs in a concentration-dependent manner. Data are shown for a single cell (left) together with a concentration-inhibition curve for pooled data from four cells (right). The fitted curve derived from: y = maximum inhibition/[1 + (IC50/adenosine concentration)nH], indicated a maximum inhibition of 40 %, an IC50 of 12 µm, and a Hill coefficient (nH) of 0.92. D, left panel, cumulative amplitude histograms of mEPSCs recorded in the presence of TTX, before and after (superimposed) application of adenosine (100 µm) showed no significant difference (Kolomogolov-Smirnov (K-S) test). Sample traces are averaged mEPSCs before and after application of adenosine (superimposed). Right panel, mean amplitude of mEPSCs before and after adenosine applications in five cells. No significant difference in paired t test. Data derived from P6 and P7 rats.
Figure 3
Figure 3. Baclofen occludes the inhibitory effect of adenosine
In the presence of baclofen (20 µm), the inhibitory effect of adenosine (100 µm) on EPSCs (a, b) was abolished (c, d). After baclofen washout, the adenosine effect was recovered (e, f). Sample traces are averaged EPSCs before and after adenosine application (superimposed) in the absence of baclofen (a, b), in the presence of baclofen (c, d), and after baclofen washout (e, f). The lower panel shows EPSC amplitude data for a single cell during 100 min of recording.
Figure 5
Figure 5. Comparison of IpCa-EPSC relationships during adenosine application and [Ca2+]o reduction
Paired recording from a calyx and its target MNTB neuron. A, EPSCs were evoked by a depolarizing pulse (1 ms duration) stepping from −70 mV to +40 mV. In the lower panels, the application of adenosine (100 µm) is indicated by a bar, and the three switches to an external solution with low [Ca2+]o/[Mg2+]o (0.5 mm/3.0 mm; each for 10–30 s) are indicated by arrowheads. IpCa (pre) and EPSC (post) before (black) and during applications of adenosine or low [Ca2+]o solution (red) are superimposed. B, the IpCa-EPSC relationship in double logarithmic plots, with data points and regression lines during adenosine application (red) and [Ca2+]o/[Mg2+]o reductions (black). Regression lines were drawn according to the least square method. C, the slope values of the regression lines compared between adenosine and low [Ca2+]o/[Mg2+]o at seven synapses. No significant difference (P = 0.81) in paired t test. The mean slope values were 1.74 ± 0.27 for adenosine and 1.75 ± 0.25 for [Ca2+]o/[Mg2+]o reduction, respectively.
Figure 6
Figure 6. Developmental decline in adenosine-induced presynaptic inhibition
A, adenosine (100 µm) only slightly attenuated EPSCs at P14 and P21. Sample traces are averaged EPSCs before (a) and after (b) adenosine applications (superimposed) in P14 and P21 rats. B, the magnitude of inhibition of EPSCs by adenosine at different postnatal periods; inhibition at P6–7 is significantly larger than at P14–16 or P20–21 (*P < 0.01, ANOVA).
Figure 7
Figure 7. ω-CgTX GVIA had no effect on the magnitude of adenosine-induced inhibition of EPSCs
A, ω-CgTX (2 µm) attenuated EPSCs (c), but did not affect the magnitude of adenosine-induced inhibition of EPSCs. Sample records are averaged EPSCs before and after adenosine application before (a, b, superimposed, left) and after ω-CgTX application (c, d, right). B, the magnitude of adenosine-induced EPSC inhibition before and after ω-CgTX application in four cells. No significant difference (P = 0.54) in paired t test.
Figure 2
Figure 2. Presynaptic inhibition by endogenous adenosine increased during high frequency stimulation
A, averaged EPSCs during a train of 30 stimuli at 10 Hz. The first EPSC (I0) and the 27th-30th EPSCs, before (black) and during (red) application of CPT (0.5 µm), are shown (superimposed). B, synaptic depression during 10 Hz stimulation. EPSCs during a train are normalized in amplitude to the first EPSC. Mean amplitudes and s.e.m.s of EPSCs (from five cells with significant increase in mean amplitude of 20th- 30th EPSCs (Iss) after CPT application, D, during 10 Hz stimulation are plotted, before (•) and during (^) CPT application. C, Time plot of I0 and Iss in a cell. Bath application of CPT (bar) increased Iss with no effect on I0. Mean amplitude of Iss before CPT application is indicated by a dashed line. D, mean amplitudes of Iss before and after application of CPT in seven cells. Difference was statistically significant (*P < 0.05) in five cells, but insignificant in two other cells.
Figure 4
Figure 4. Inhibitory effect of adenosine on presynaptic Ca2+ currents
A, Ca2+ currents were evoked by a depolarizing command pulse (10 ms) stepping from −80 mV to 0 mV (a). Adenosine (100 µm) attenuated Ca2+ currents (b). Current-voltage relationships before (^) and after (•) adenosine application (from 5 cells in P6–7 rats). Current amplitudes were measured 2 ms after the onset of command pulse and normalized to the control value at 0 mV. B, lack of effect of adenosine on presynaptic voltage-dependent potassium currents. Sample traces in inset are outward potassium currents evoked by 20 mV depolarizing steps from the holding potential of −70 mV to +30 mV in the presence of TTX before (left) and after (middle) adenosine application. The superimposed traces before and after adenosine application overlap almost completely (right). In the current-voltage relationship, the amplitudes of potassium currents were normalized to the control value at +10 mV. Mean values ± 5 s.e.m.s of 6 calyces before (^) and after (▾) adenosine applications are plotted against membrane potential.
Figure 8
Figure 8. Western blot analysis of A1 receptors
Samples from the MNTB region at each age (P7, P16 and P21) were separated with SDS-PAGE for immunoblot detection. Arrowheads indicate the positions corresponding to the molecular mass, and an open arrowhead indicates the position expected for A1 receptors. The A1 receptor signal intensity at each lane was measured using densitometry, and normalized to the mean value (of three samples, two of which are shown) at P7. Bar graphs indicate the mean values and s.e.m. (from three experiments) for the A1 receptor signal intensity representing the relative amount of A1 receptor protein, which was significantly different between P7 and P16, and between P7 and P21 (*P < 0.01, ANOVA).
Figure 9
Figure 9. Developmental reduction in the immunoreactivity of A1 receptors at the calyx of Held synapse
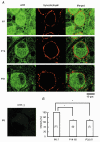
A, A1 receptor immunoreactivity is visualized with Alexa fluor 488 (green). As a presynaptic marker, synaptophysin immunoreactivity was visualized with Alexa fluor 568 (red). The presynaptic intensity of A1 receptor immunofluorescence deduced from an overlap with synaptophysin immunofluorescence (yellow) decreased from P7 to P14. Postsynaptic A1 receptor immunofluorescence (green, not overlapped with synaptophysin) similarly decreased in intensity with development. Bottom left, background signal of secondary antibody (A1R (-)). B, densitometric quantification of the presynaptic A1 receptor immunofluorescence. Bar graphs represent the mean A1 receptor signal intensity at each age relative to the mean value at P7. Error bars indicate +s.e.m. of 7–11 cells (numbers indicated in each column). * Significant difference between P6–7 and P14–16, and between P6–7 and P20–21 (P < 0.01, ANOVA).

Similar articles

Cited by

References

    1. Arrigoni E, Rainnie DG, McCarley RW, Greene RW. Adenosine- mediated presynaptic modulation of glutamatergic transmission in the laterodorsal tegmentum. J Neurosci. 2001;21:1076–1085. - PMC - PubMed
    1. Bagley EE, Vaughan CW, Christie MJ. Inhibition by adenosine receptor agonists of synaptic transmission in rat periaqueductal grey neurons. J Physiol. 1999;516:219–225. - PMC - PubMed
    1. Barnes-Davies M, Forsythe ID. Pre- and postsynaptic glutamate receptors at a giant excitatory synapse in rat auditory brain stem slices. J Physiol. 1995;488:387–406. - PMC - PubMed
    1. Baskys A, Malenka RC. Agonists at metabotropic glutamate receptors presynaptically inhibit EPSCs in neonatal rat hippocampus. J Physiol. 1991;444:687–701. - PMC - PubMed
    1. Currie KPM, Fox AP. Comparison of N- and P/Q-type voltage-gated calcium channel current inhibition. J Neurosci. 1997;17:4570–4579. - PMC - PubMed

Publication types

MeSH terms

LinkOut - more resources