

Comment
doi: 10.1073/pnas.2034937100.
Epub 2003 Sep 8.
Extending the utility of gene profiling data by bridging microarray platforms
Affiliations
- PMID: 12963810
- PMCID: PMC196845
- DOI: 10.1073/pnas.2034937100
Item in Clipboard
Comment
Extending the utility of gene profiling data by bridging microarray platforms
Proc Natl Acad Sci U S A.
.
No abstract available
Figures
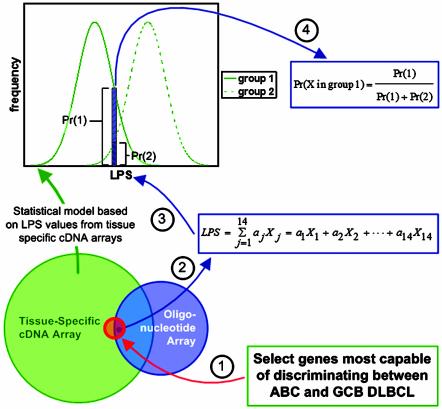
Schematic representation of how gene expression results can be compared across microarray platforms. The Venn diagram illustrates the overlap among all clones on the tissue-specific cDNA array and oligonucleotide array probe sets. The red circle in the center of the Venn diagram represents the 27 genes on the cDNA array used to classify the DLBCL samples as GCB, ABC, or other. The intersection among the three sections of the Venn diagram (the right portion of the red circle) represents the 14 significant genes that are found on the oligonucleotide array. General methodology: (1) Identify discriminating genes by using cDNA data. (2) The LPS score is calculated by using the adjusted oligonucleotide expression values, the weights (aj) are the same as those used when classifying the cDNA array data. Expression values for each gene are adjusted by scaling and shifting the mean and variance of the 14 measurements so that they match the data for that same gene on the cDNA array. The distribution of LPS values from the two groups (from clustered cDNA array data) (3) are used to calculate the probability that the tumor sample falls into either group 1 or 2 (4). The equation used to calculate the probability assumes that the sample must fall into either group 1 or group 2. Samples with a probability <90% are assumed to fall into group 3.
Comment on
-
A gene expression-based method to diagnose clinically distinct subgroups of diffuse large B cell lymphoma.Proc Natl Acad Sci U S A. 2003 Aug 19;100(17):9991-6. doi: 10.1073/pnas.1732008100. Epub 2003 Aug 4. Proc Natl Acad Sci U S A. 2003. PMID: 12900505 Free PMC article.
References
Publication types
MeSH terms
Substances
Grants and funding
LinkOut - more resources
Full Text Sources
