

Cholesterol-induced conformational change in SCAP enhanced by Insig proteins and mimicked by cationic amphiphiles
- PMID: 12963821
- PMCID: PMC196858
- DOI: 10.1073/pnas.1534833100
Cholesterol-induced conformational change in SCAP enhanced by Insig proteins and mimicked by cationic amphiphiles
Abstract
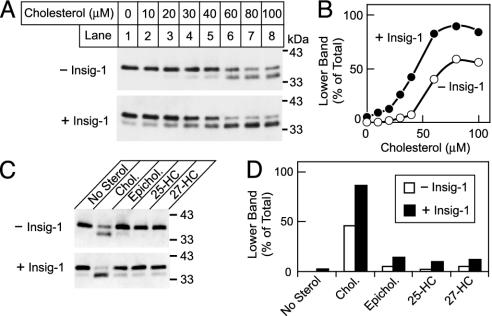
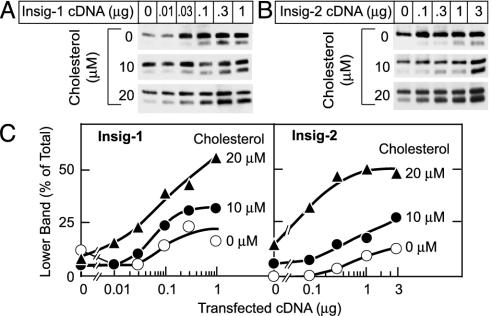
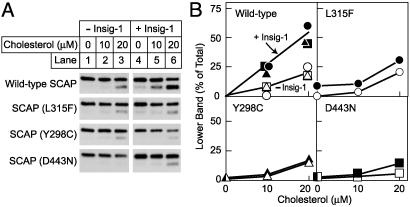
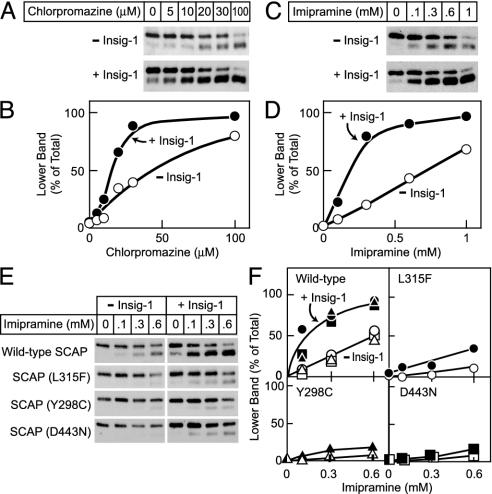
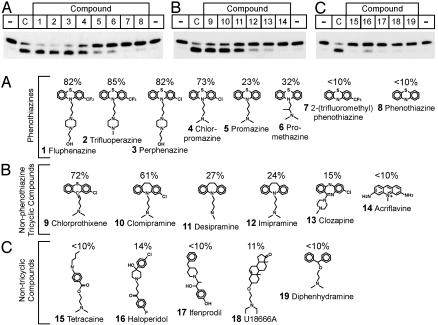
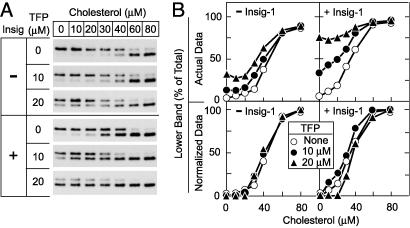
Sterols mediate feedback inhibition of the sterol regulatory element-binding protein (SREBP) pathway by preventing movement of the SREBP cleavage-activating protein (SCAP)/SREBP complex from endoplasmic reticulum (ER) to Golgi, where proteolytic cleavage of SREBPs releases the transcription factor domain that activates genes for lipid biosynthesis. Our laboratory previously used a trypsin cleavage assay to show that the conformation of SCAP is altered in vitro by addition of cholesterol to ER membranes. More recently, Insig-1 and Insig-2 were identified as ER resident proteins that bind the SCAP/SREBP complex and promote its ER retention when cells are treated with sterols. Here, we use the trypsin assay to show that Insig proteins reduce the concentration of cholesterol needed in vitro to produce the conformational change in SCAP. Insig-1 and Insig-2 also enhance the conformational change in SCAP that occurs upon addition of certain cationic amphiphiles, such as chlorpromazine, trifluoperazine, and imipramine, which mimic the effect of cholesterol. The effects of cationic amphiphiles raise the possibility that SCAP may monitor specifically the composition of the cytoplasmic leaflet of the ER membrane.
Figures
Similar articles
-
Sterol-regulated ubiquitination and degradation of Insig-1 creates a convergent mechanism for feedback control of cholesterol synthesis and uptake.Cell Metab. 2006 Jan;3(1):15-24. doi: 10.1016/j.cmet.2005.11.014. Cell Metab. 2006. PMID: 16399501
-
Crucial step in cholesterol homeostasis: sterols promote binding of SCAP to INSIG-1, a membrane protein that facilitates retention of SREBPs in ER.Cell. 2002 Aug 23;110(4):489-500. doi: 10.1016/s0092-8674(02)00872-3. Cell. 2002. PMID: 12202038
-
Insig-2, a second endoplasmic reticulum protein that binds SCAP and blocks export of sterol regulatory element-binding proteins.Proc Natl Acad Sci U S A. 2002 Oct 1;99(20):12753-8. doi: 10.1073/pnas.162488899. Epub 2002 Sep 19. Proc Natl Acad Sci U S A. 2002. PMID: 12242332 Free PMC article.
-
Retrospective on Cholesterol Homeostasis: The Central Role of Scap.Annu Rev Biochem. 2018 Jun 20;87:783-807. doi: 10.1146/annurev-biochem-062917-011852. Epub 2017 Aug 25. Annu Rev Biochem. 2018. PMID: 28841344 Free PMC article. Review.
-
Molecular regulation of SREBP function: the Insig-SCAP connection and isoform-specific modulation of lipid synthesis.Biochem Cell Biol. 2004 Feb;82(1):201-11. doi: 10.1139/o03-090. Biochem Cell Biol. 2004. PMID: 15052338 Review.
Cited by
-
Intramembrane aspartic acid in SCAP protein governs cholesterol-induced conformational change.Proc Natl Acad Sci U S A. 2005 Mar 1;102(9):3242-7. doi: 10.1073/pnas.0500206102. Epub 2005 Feb 22. Proc Natl Acad Sci U S A. 2005. PMID: 15728349 Free PMC article.
-
Overweight induced by chronic risperidone exposure is correlated with overexpression of the SREBP-1c and FAS genes in mouse liver.Naunyn Schmiedebergs Arch Pharmacol. 2011 Apr;383(4):423-36. doi: 10.1007/s00210-010-0597-3. Epub 2011 Feb 19. Naunyn Schmiedebergs Arch Pharmacol. 2011. PMID: 21336545
-
Activation of peroxisome proliferator-activated receptor-alpha in mice induces expression of the hepatic low-density lipoprotein receptor.Br J Pharmacol. 2008 Oct;155(4):596-605. doi: 10.1038/bjp.2008.331. Epub 2008 Aug 18. Br J Pharmacol. 2008. PMID: 18852694 Free PMC article.
-
Activation mobilizes the cholesterol in the late endosomes-lysosomes of Niemann Pick type C cells.PLoS One. 2012;7(1):e30051. doi: 10.1371/journal.pone.0030051. Epub 2012 Jan 20. PLoS One. 2012. PMID: 22276143 Free PMC article.
-
Overexpression of Insig-1 in the livers of transgenic mice inhibits SREBP processing and reduces insulin-stimulated lipogenesis.J Clin Invest. 2004 Apr;113(8):1168-75. doi: 10.1172/JCI20978. J Clin Invest. 2004. PMID: 15085196 Free PMC article.
References
Publication types
MeSH terms
Substances
Grants and funding
LinkOut - more resources
Full Text Sources
Other Literature Sources
Medical
