

Overexpression of the human MNB/DYRK1A gene induces formation of multinucleate cells through overduplication of the centrosome
- PMID: 12964950
- PMCID: PMC212362
- DOI: 10.1186/1471-2121-4-12
Overexpression of the human MNB/DYRK1A gene induces formation of multinucleate cells through overduplication of the centrosome
Abstract
Background: Previously we cloned the human MNB/DYRK1A gene from the "Down syndrome critical region" on chromosome 21. This gene encodes a dual specificity protein kinase that catalyzes its autophosphorylation on serine/threonine and tyrosine residues. But, the functions of the MNB/DYRK1A gene in cellular processes are unknown.
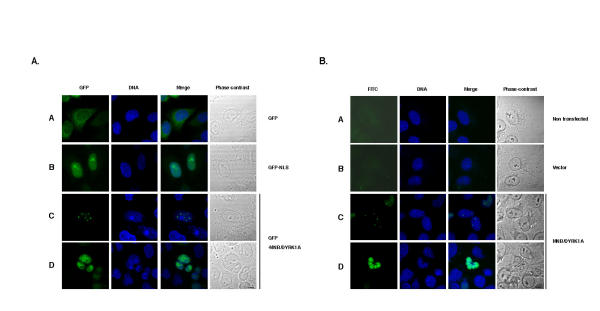
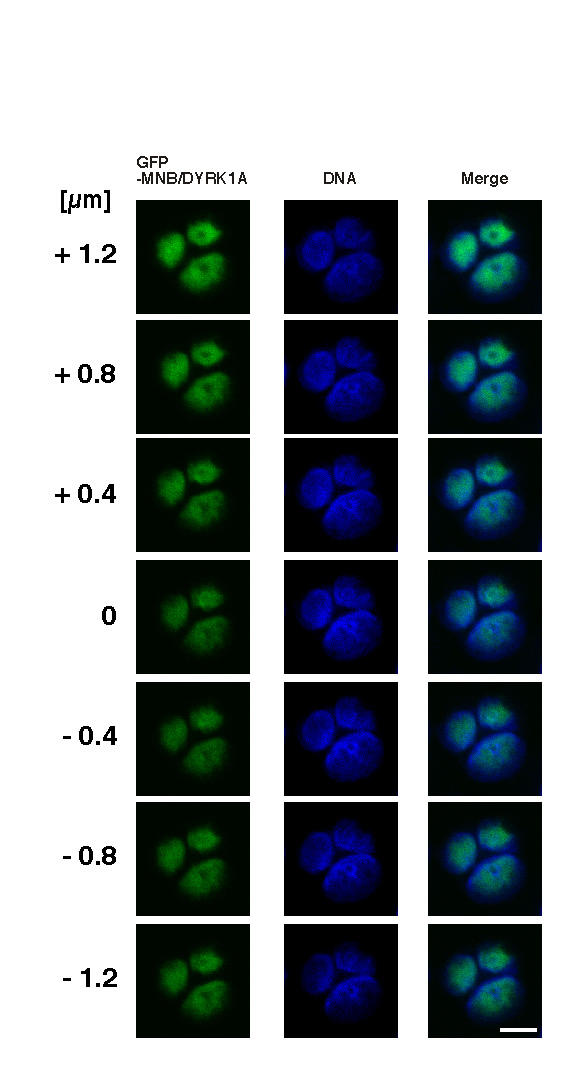
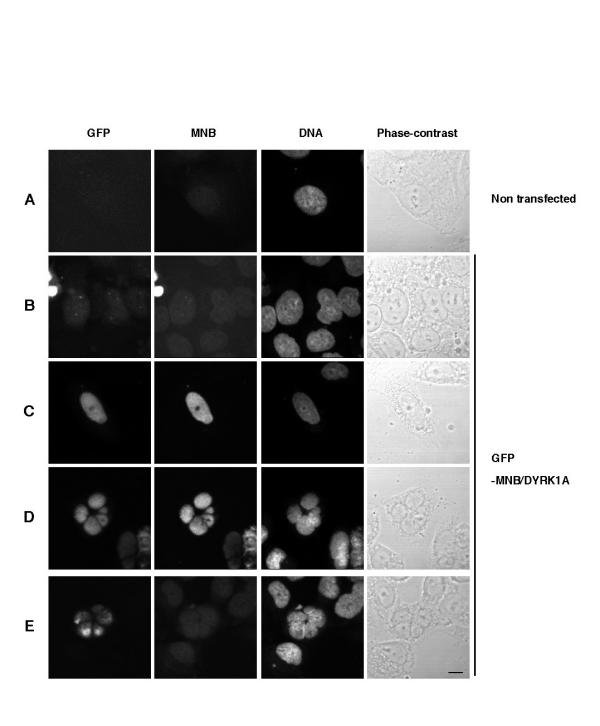
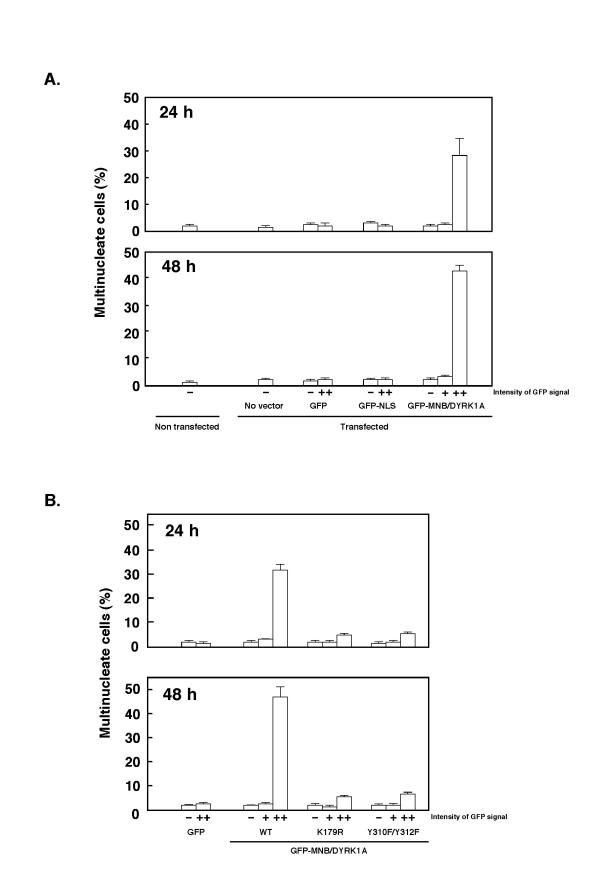
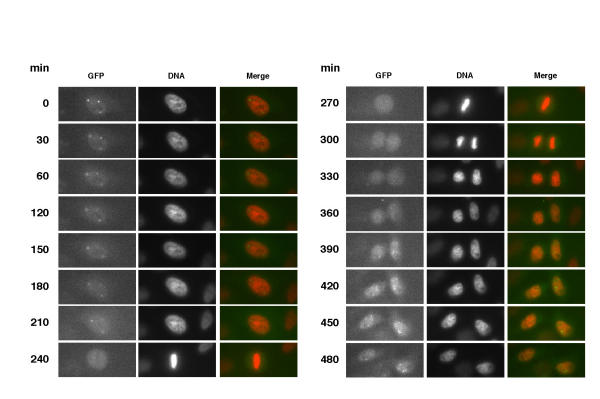
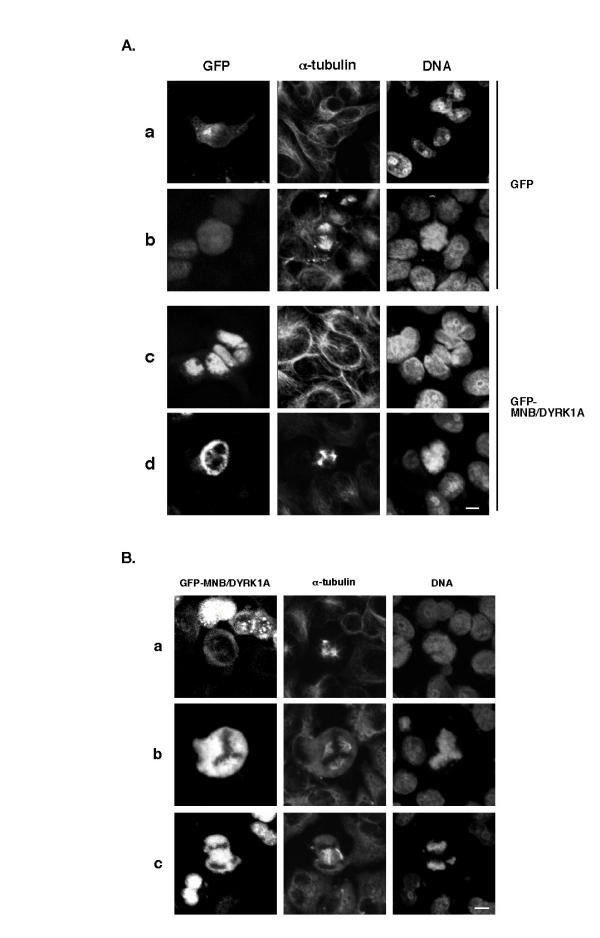
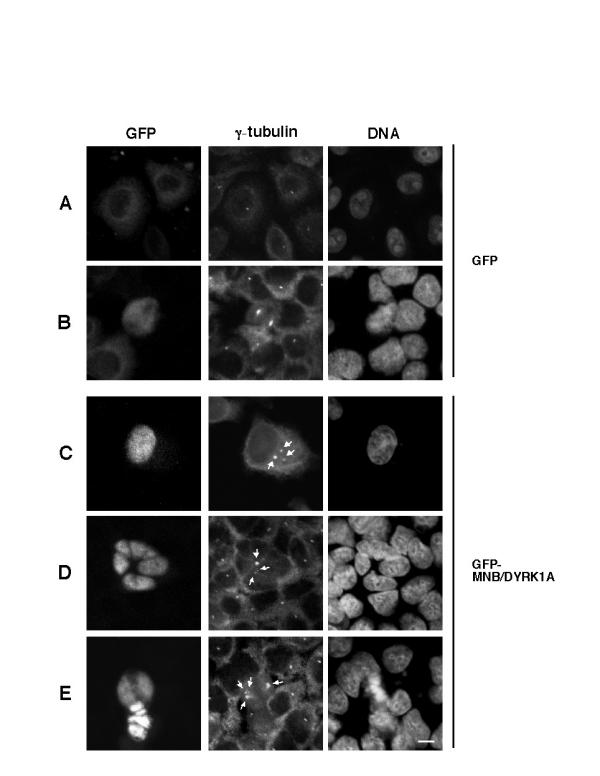
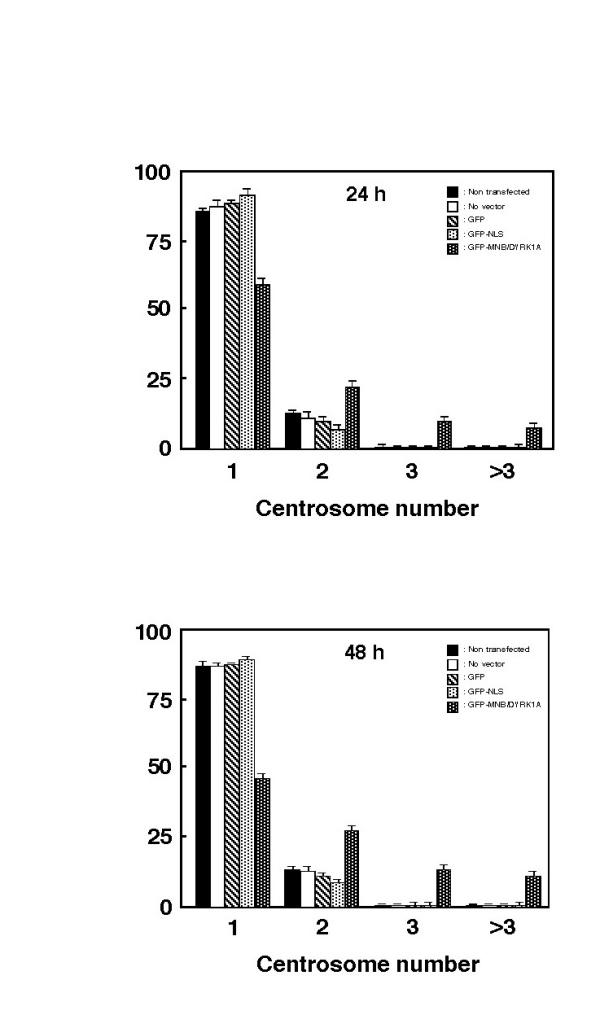
Results: In this study, we examined HeLa cells transfected with cDNA encoding a green fluorescent protein (GFP)-MNB/DYRK1A fusion protein and found 2 patterns of expression: In one group of transfected cells, GFP-MNB/DYRK1A was localized as dots within the nucleus; and in the other group, it was overexpressed and had accumulated all over the nucleus. In the cells overexpressing GFP-MNB/DYRK1A, multinucleation was clearly observed; whereas in those with the nuclear dots, such aberrant nuclei were not found. Furthermore, in the latter cells, essential processes such as mitosis and cytokinesis occurred normally. Multinucleation was dependent on the kinase activity of MNB/DYRK1A, because it was not observed in cells overexpressing kinase activity-negative mutants, GFP-MNB/DYRK1A (K179R) and GFP-MNB/DYRK1A (Y310F/Y312F). Immunostaining of GFP-MNB/DYRK1A-overexpressing cells with specific antibodies against alpha- and gamma-tubulin revealed that multiple copies of centrosomes and aberrant multipolar spindles were generated in these cells.
Conclusions: These results indicate that overexpression of MNB/DYRK1A induces multinucleation in HeLa cells through overduplication of the centrosome during interphase and production of aberrant spindles and missegregation of chromosomes during mitosis.
Figures
Similar articles
-
Cell type- and brain structure-specific patterns of distribution of minibrain kinase in human brain.Brain Res. 2004 Jun 4;1010(1-2):69-80. doi: 10.1016/j.brainres.2004.03.008. Brain Res. 2004. PMID: 15126119
-
Dual-specificity tyrosine-phosphorylated and regulated kinase 1A (DYRK1A) interacts with the phytanoyl-CoA alpha-hydroxylase associated protein 1 (PAHX-AP1), a brain specific protein.Int J Biochem Cell Biol. 2005 Apr;37(4):775-83. doi: 10.1016/j.biocel.2004.12.006. Int J Biochem Cell Biol. 2005. PMID: 15694837
-
The spatio-temporal and subcellular expression of the candidate Down syndrome gene Mnb/Dyrk1A in the developing mouse brain suggests distinct sequential roles in neuronal development.Eur J Neurosci. 2008 Mar;27(5):1061-74. doi: 10.1111/j.1460-9568.2008.06092.x. Eur J Neurosci. 2008. PMID: 18364031
-
MNB/DYRK1A as a multiple regulator of neuronal development.FEBS J. 2011 Jan;278(2):223-35. doi: 10.1111/j.1742-4658.2010.07954.x. Epub 2010 Dec 13. FEBS J. 2011. PMID: 21156027 Review.
-
The MNB/DYRK1A protein kinase: neurobiological functions and Down syndrome implications.J Neural Transm Suppl. 2003;(67):129-37. doi: 10.1007/978-3-7091-6721-2_11. J Neural Transm Suppl. 2003. PMID: 15068245 Review.
Cited by
-
DYRK1A controls the transition from proliferation to quiescence during lymphoid development by destabilizing Cyclin D3.J Exp Med. 2015 Jun 1;212(6):953-70. doi: 10.1084/jem.20150002. Epub 2015 May 25. J Exp Med. 2015. PMID: 26008897 Free PMC article.
-
The nuclear interactome of DYRK1A reveals a functional role in DNA damage repair.Sci Rep. 2019 Apr 25;9(1):6539. doi: 10.1038/s41598-019-42990-5. Sci Rep. 2019. PMID: 31024071 Free PMC article.
-
Transient expression of Mnb/Dyrk1a couples cell cycle exit and differentiation of neuronal precursors by inducing p27KIP1 expression and suppressing NOTCH signaling.Development. 2011 Jun;138(12):2543-54. doi: 10.1242/dev.066167. Development. 2011. PMID: 21610031 Free PMC article.
-
Multicolor FISHs for simultaneous detection of genes and DNA segments on human chromosomes.Chromosome Res. 2015 Dec;23(4):649-62. doi: 10.1007/s10577-015-9473-9. Epub 2015 May 8. Chromosome Res. 2015. PMID: 25947045 Review.
-
The androgen and progesterone receptors regulate distinct gene networks and cellular functions in decidualizing endometrium.Endocrinology. 2008 Sep;149(9):4462-74. doi: 10.1210/en.2008-0356. Epub 2008 May 29. Endocrinology. 2008. PMID: 18511503 Free PMC article.
References
-
- Epstein CJ. The Consequences of Chromosome Imbalance: Principles, Mechanisms, and Models. Cambridge Univ Press New York. 1986.
-
- Korenberg JR, Chen XN, Schipper R, Sun Z, Gonsky R, Gerwehr S, Carpenter N, Daumer C, Dignan P, Disteche C, Graham JM, Hugdins L, McGillivray B, Miyazaki K, Ogasawara N, Park JP, Pagon R, Pueschel S, Sack G, Say B, Schuffenhauer S, Soukup S, Yamanaka T. Down syndrome phenotypes: the consequences of chromosomal imbalance. Proc Natl Acad Sci USA. 1994;91:4997–5001. - PMC - PubMed
-
- Delabar JM, Theophile D, Rahmani Z, Chettouh Z, Blouin JL, Prieur M, Noel B, Sinet PM. Molecular mapping of twenty-four features of Down syndrome on chromosome 21. Eur J Hum Genet. 1993;1:114–124. - PubMed
Publication types
MeSH terms
Substances
LinkOut - more resources
Full Text Sources
