Increased expression of the ubiquitin-proteasome pathway in murine myotubes by proteolysis-inducing factor (PIF) is associated with activation of the transcription factor NF-kappaB
- PMID: 12966435
- PMCID: PMC2376944
- DOI: 10.1038/sj.bjc.6601132
Increased expression of the ubiquitin-proteasome pathway in murine myotubes by proteolysis-inducing factor (PIF) is associated with activation of the transcription factor NF-kappaB
Abstract
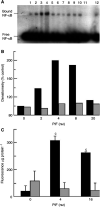
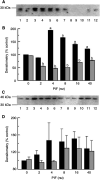
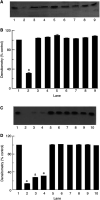
Proteolysis-inducing factor (PIF), isolated from a cachexia-inducing murine tumour, has been shown to stimulate protein breakdown in C(2)C(12) myotubes. The effect was attenuated by the specific proteasome inhibitor lactacystin and there was an elevation of proteasome 'chymotrypsin-like' enzyme activity and expression of 20S proteasome alpha-subunits at concentrations of PIF between 2 and 16 nM. Higher concentrations of PIF had no effect. The action of PIF was attenuated by eicosapentaenoic acid (EPA) (50 microM). At a concentration of 4 nM, PIF induced a transient decrease in IkappaBalpha levels after 30 min incubation, while no effect was seen at 20 nM PIF. The level of IkappaBalpha, an NF-kappaB inhibitory protein, returned to normal after 60 min. Depletion of IkappaBalpha from the cytosol was not seen in myotubes pretreated with EPA, suggesting that the NF-kappaB/IkappaB complex was stabilised. At concentrations between 2 and 8 nM, PIF stimulated an increased nuclear migration of NF-kappaB, which was not seen in myotubes pretreated with EPA. The PIF-induced increase in chymotrypsin-like enzyme activity was also attenuated by the NF-kappaB inhibitor peptide SN50, suggesting that NF-kappaB may be involved in the PIF-induced increase in proteasome expression. The results further suggest that EPA may attenuate protein degradation induced by PIF, at least partly, by preventing NF-kappaB accumulation in the nucleus.
Figures


Similar articles
-
Induction of protein catabolism in myotubes by 15(S)-hydroxyeicosatetraenoic acid through increased expression of the ubiquitin-proteasome pathway.Br J Cancer. 2003 Aug 18;89(4):737-45. doi: 10.1038/sj.bjc.6601184. Br J Cancer. 2003. PMID: 12915888 Free PMC article.
-
Induction of proteasome expression in skeletal muscle is attenuated by inhibitors of NF-kappaB activation.Br J Cancer. 2004 Nov 1;91(9):1742-50. doi: 10.1038/sj.bjc.6602165. Br J Cancer. 2004. PMID: 15477867 Free PMC article.
-
Role of protein kinase C and NF-kappaB in proteolysis-inducing factor-induced proteasome expression in C(2)C(12) myotubes.Br J Cancer. 2004 May 4;90(9):1850-7. doi: 10.1038/sj.bjc.6601767. Br J Cancer. 2004. PMID: 15150589 Free PMC article.
-
Control of IkappaBalpha proteolysis by the ubiquitin-proteasome pathway.Biochimie. 2001 Mar-Apr;83(3-4):351-6. doi: 10.1016/s0300-9084(01)01237-8. Biochimie. 2001. PMID: 11295496 Review.
-
The ubiquitin-proteasome pathway as a therapeutic target for muscle wasting.J Support Oncol. 2005 May-Jun;3(3):209-17. J Support Oncol. 2005. PMID: 15915823 Review.
Cited by
-
The multiple facets of dermcidin in cell survival and host defense.J Innate Immun. 2012;4(4):349-60. doi: 10.1159/000336844. Epub 2012 Mar 27. J Innate Immun. 2012. PMID: 22455996 Free PMC article. Review.
-
A Double-Blind, Placebo-Controlled Randomized Phase IIa Study: Evaluating the Effect of Curcumin for Treatment of Cancer Anorexia-Cachexia Syndrome in Solid Cancer Patients.Asian Pac J Cancer Prev. 2022 Jul 1;23(7):2333-2340. doi: 10.31557/APJCP.2022.23.7.2333. Asian Pac J Cancer Prev. 2022. PMID: 35901339 Free PMC article. Clinical Trial.
-
Prognostic model based on the geriatric nutritional risk index and sarcopenia in patients with diffuse large B-cell lymphoma.BMC Cancer. 2020 May 18;20(1):439. doi: 10.1186/s12885-020-06921-2. BMC Cancer. 2020. PMID: 32423395 Free PMC article.
-
SIRT1-NOX4 signaling axis regulates cancer cachexia.J Exp Med. 2020 Jul 6;217(7):e20190745. doi: 10.1084/jem.20190745. J Exp Med. 2020. PMID: 32441762 Free PMC article.
-
Thalidomide in the treatment of cancer cachexia: a randomised placebo controlled trial.Gut. 2005 Apr;54(4):540-5. doi: 10.1136/gut.2004.047563. Gut. 2005. PMID: 15753541 Free PMC article. Clinical Trial.
References
-
- Baeurele PA, Baltimore D (1996) NF-κB: ten years after. Cell 87: 13–20 - PubMed
-
- Beck SA, Smith KL, Tisdale MJ (1991) Anticachectic and antitumor effect of eicosapentaenoic acid and its effect on protein turnover. Cancer Res 51: 6089–6093 - PubMed
-
- Bibby MC, Double JA, Ali SA, Fearon KCH, Brennan RA, Tisdale MJ (1987) Characterization of a transplantable adenocarcinoma of the mouse colon producing cachexia in recipient animals. J Natl Cancer Inst 78: 539–546 - PubMed
-
- Biolo G, Bosutti A, Iscara F, Toigo G, Gullo A, Guarnieri G (2000) Contribution of the ubiquitin–proteasome pathway to overall muscle proteolysis in hypercatabolic patients. Metabolism 49: 689–691 - PubMed
-
- Bonizzi G, De Jardin E, Piret B, Piette J, Merville MP, Bours V (1996) Interleukin-1 induces NF-κB in epithelial cells independently of the production of reactive oxygen intermediates. Eur J Biochem 242: 544–549 - PubMed
Publication types
MeSH terms
Substances
LinkOut - more resources
Full Text Sources
Other Literature Sources
Research Materials

