. 2003 Sep 10;23(23):8212-20.
doi: 10.1523/JNEUROSCI.23-23-08212.2003.

Brain-derived neurotrophic factor stimulates energy metabolism in developing cortical neurons

Affiliations

Brain-derived neurotrophic factor stimulates energy metabolism in developing cortical neurons

Julia Burkhalter et al. J Neurosci. .

Abstract

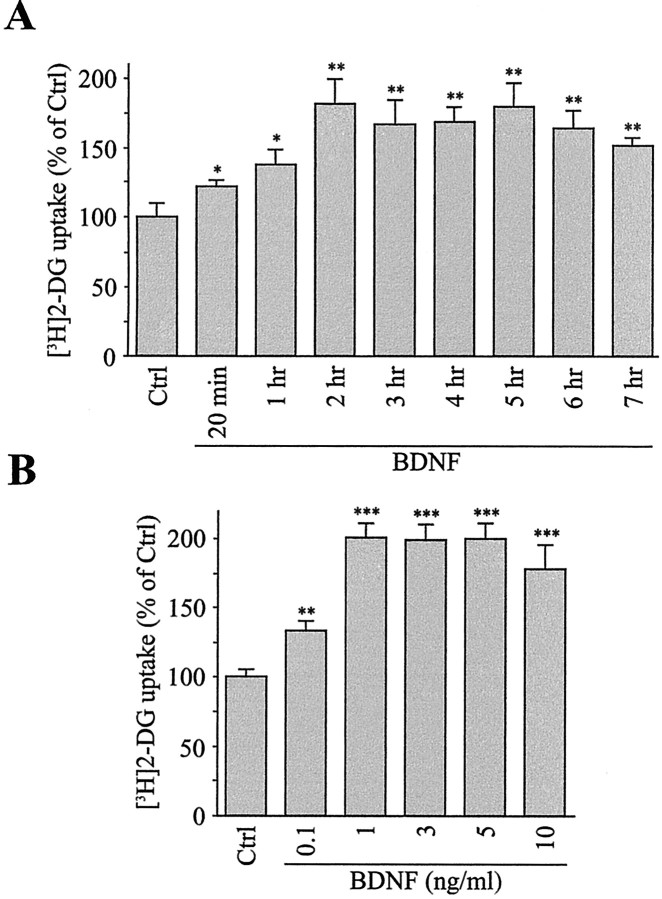
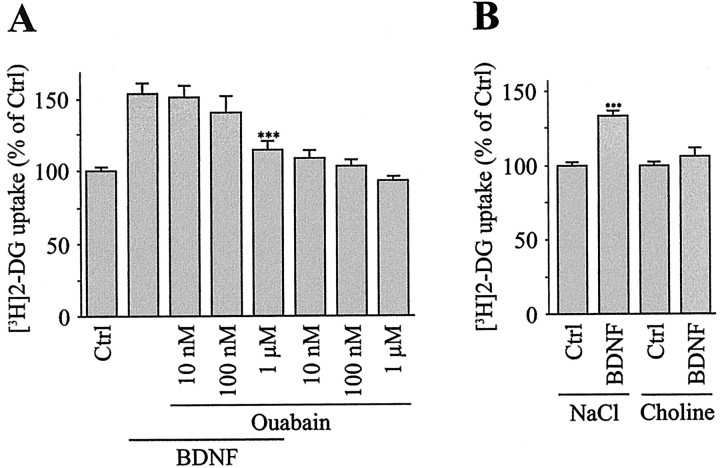
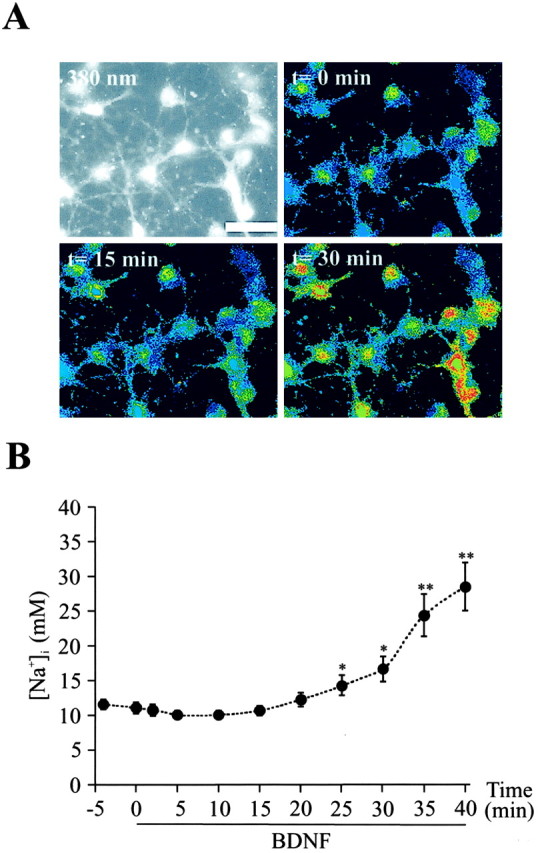
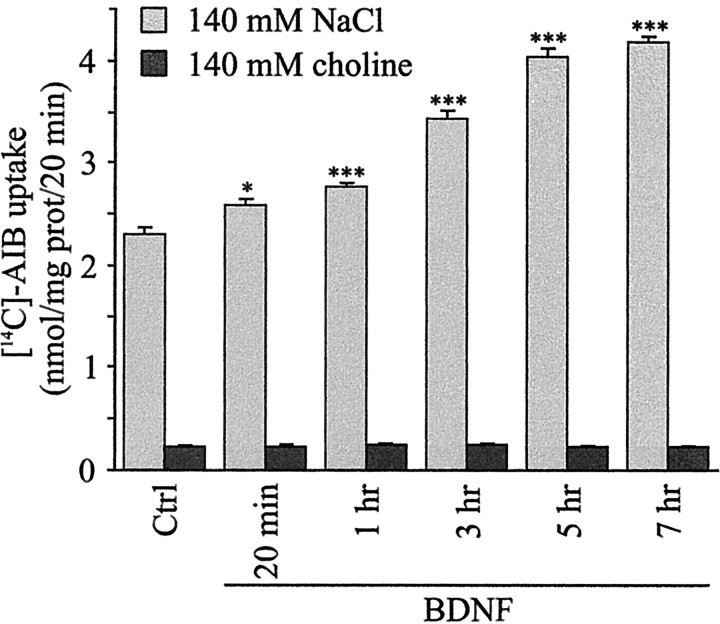
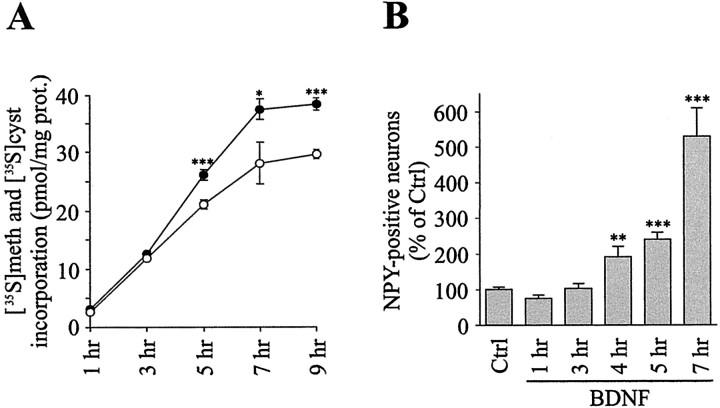
Brain-derived neurotrophic factor (BDNF) promotes the biochemical and morphological differentiation of selective populations of neurons during development. In this study we examined the energy requirements associated with the effects of BDNF on neuronal differentiation. Because glucose is the preferred energy substrate in the brain, the effect of BDNF on glucose utilization was investigated in developing cortical neurons via biochemical and imaging studies. Results revealed that BDNF increases glucose utilization and the expression of the neuronal glucose transporter GLUT3. Stimulation of glucose utilization by BDNF was shown to result from the activation of Na+/K+-ATPase via an increase in Na+ influx that is mediated, at least in part, by the stimulation of Na+-dependent amino acid transport. The increased Na+-dependent amino acid uptake by BDNF is followed by an enhancement of overall protein synthesis associated with the differentiation of cortical neurons. Together, these data demonstrate the ability of BDNF to stimulate glucose utilization in response to an enhanced energy demand resulting from increases in amino acid uptake and protein synthesis associated with the promotion of neuronal differentiation by BDNF.


Figures

Figure 1.
Figure 1.
BDNF increases [3H]2-DG uptake in cortical neurons. A, Time course analysis. Cultures of cortical neurons were stimulated by 5 ng/ml BDNF for various periods of time. [3H]2-DG uptake was measured as described in Materials and Methods. Data are the mean ± SEM percentages of control (Ctrl) values of triplicate determinations from three independent experiments. *p < 0.05, **p < 0.01 by unpaired Student's t test between Ctrl and BDNF-treated cultures. B, Concentration dependency. Cultures of cortical neurons were treated for 2 hr with increasing concentrations of BDNF. [3H]2-DG uptake was measured as described in Materials and Methods. Data are the mean ± SEM percentages of Ctrl values of triplicate determinations from three independent experiments. **p < 0.01, ***p < 0.001 by unpaired Student's t test between Ctrl and BDNF-treated cultures.
Figure 2.
Figure 2.
Effects of inhibitors of TrkB-mediated signaling pathways on BDNF-induced [3H]2-DG uptake. Cultures of cortical neurons were exposed to 5 ng/ml BDNF for 2 hr in the presence of different inhibitors. Inhibitors also were tested on basal [3H]2-DG uptake. A, Effect of the tyrosine kinase inhibitor K252a (200 nm) on BDNF-induced [3H]2-DG uptake. Data are the mean ± SEM percentages of Ctrl values of triplicate determinations from three independent experiments. ***p < 0.001 by unpaired Student's t test between BDNF- and BDNF + K252a-treated cultures. B, Effects of the MAPK kinase inhibitor PD98059 (50 μm) and the PI3K inhibitor LY294002 (10 μm) on BDNF-induced [3H]2-DG uptake. Data are the mean ± SEM percentages of Ctrl values of triplicate determinations from at least three independent experiments. C, Effects of the PLC inhibitor U73122 (10 μm) and of its inactive analog U73343 (10 μm) on BDNF-stimulated [3H]2-DG uptake. Data represent the mean ± SEM percentages of Ctrl values of triplicate determinations from at least three independent experiments. ***p < 0.001 by unpaired Student's t test between BDNF- and BDNF + U73122-treated cultures.
Figure 3.
Figure 3.
Kinetic analysis of the increase in [3H]2-DG uptake by BDNF. Cultures of cortical neurons were treated for 2 hr with 5 ng/ml BDNF in DMEM containing increasing concentrations of glucose. A, Rate of [3H]2-DG uptake as a function of increasing concentrations of glucose in control (○) or BDNF-treated (•) neurons. Data are the mean ± SEM values of triplicate determinations from three independent experiments. B, Double-reciprocal plots of the results presented in A. Lineweaver-Burk plots yield straight lines, where x- and y-intercepts are -1/Km and 1/Vmax, respectively.
Figure 4.
Figure 4.
BDNF stimulates GLUT3 mRNA and protein expression in cortical neurons. A, Time course analysis of GLUT3 mRNA changes induced by BDNF. Cultures of cortical neurons were exposed for various periods of time to 5 ng/ml BDNF. Extractions of total RNA and Northern blot analysis were performed as described in Materials and Methods. B, Concentration dependency of GLUT3 mRNA changes in response to BDNF. Cultures of cortical neurons were treated for 2 hr with increasing concentrations of BDNF. C, D, Quantitative analysis of the results presented in A and B. Data are the mean ± SEM percentages of Ctrl values from three independent experiments. E, Time course analysis of GLUT3 protein changes in response to BDNF. Cultures of cortical neurons were exposed for various periods of time to 5 ng/ml BDNF. Western blot analysis was performed as described in Materials and Methods. F, Quantitative analysis of the results presented in E.
Figure 5.
Figure 5.
Stimulation of [3H]2-DG uptake by BDNF is inhibited by applying ouabain and by lowering the extracellular Na+ concentration. A, Cultures of cortical neurons were stimulated for 2 hr by 5 ng/ml BDNF in the presence of increasing concentrations of the Na+/K+-ATPase inhibitor ouabain. Ouabain also was tested on basal [3H]2-DG uptake. Data represent the mean ± SEM percentages of Ctrl values of triplicate determinations from two independent experiments. ***p < 0.001 by unpaired Student's t test between cultures treated with BDNF and BDNF + 1 μm ouabain. B, Cultures of cortical neurons were exposed for 2 hr to 5 ng/ml BDNF in a medium containing 140 mm NaCl or 140 mm choline, respectively. Data represent the mean ± SEM percentages of Ctrl values of triplicate determinations from two independent experiments. ***p < 0.001 by unpaired Student's t test between Ctrl and BDNF-treated cultures.
Figure 6.
Figure 6.
BDNF increases the intracellular Na+ concentration ([Na+]i) in cortical neurons. A, Images of SBFI-loaded neurons showing a raw fluorescence image excited at 380 nm (top left) and false color excitation ratio images (340/380 nm) recorded under control conditions (top right) after 15 min (bottom left) and 30 min (bottom right), respectively, of treatment with 10 ng/ml BDNF. Scale bar, 20 μm. B, Changes in [Na+]i were measured in SBFI-AM-loaded neurons stimulated by 10 ng/ml BDNF. At the indicated time points [Na+]i values of 13-22 neurons from four independent experiments were averaged and presented as the mean ± SEM values. *p < 0.05, **p < 0.001 by paired Student's t test between t = 0 min and t = 2-40 min after treatment with BDNF.
Figure 7.
Figure 7.
BDNF increases Na+-dependent [14C]-AIB uptake in cortical neurons. Cultures of cortical neurons were exposed for different time periods to 5 ng/ml BDNF in a medium containing either 140 mm NaCl to determine total [14C]-AIB uptake or 140 mm choline to determine Na+-independent [14C]-AIB uptake. [14C]-AIB uptake was determined as described in Materials and Methods. Data are the mean ± SEM values of six determinations from two independent experiments. *p < 0.05, ***p < 0.001 by unpaired Student's t test between Ctrl and BDNF-treated cultures.
Figure 8.
Figure 8.
BDNF increases overall protein synthesis and the number of NPY-positive neurons. A, Cultures of cortical neurons were stimulated for different time periods by 5 ng/ml BDNF. Overall protein synthesis was determined by measuring the incorporation of [35S]methionine and [35S]cysteine into newly synthesized proteins in Ctrl (○) or BDNF-treated (•) neurons. Data represent the mean ± SEM values of six determinations from two independent experiments. *p < 0.05, ***p< 0.001 by unpaired Student's t test between Ctrl and BDNF-treated cultures. B, Cultures of cortical neurons were exposed to 5 ng/ml BDNF for different time periods, and the detection of NPY-positive neurons was performed by immunocytochemistry. Data are the mean ± SEM percentages of Ctrl values of six determinations from two independent experiments. **p < 0.01, ***p < 0.001 by unpaired Student's t test between Ctrl and BDNF-treated cultures.

References

    1. Ames 3rd A ( 2000) CNS energy metabolism as related to function. Brain Res Brain Res Rev 34 : 42-68. - PubMed
    1. Astrup J, Sorensen PM, Sorensen HR ( 1981) Oxygen and glucose consumption related to Na+/K+ transport in canine brain. Stroke 12 : 726-730. - PubMed
    1. Attwell D, Laughlin SB ( 2001) An energy budget for signaling in the grey matter of the brain. J Cereb Blood Flow Metab 21 : 1133-1145. - PubMed
    1. Barbacid M ( 1994) The Trk family of neurotrophin receptors. J Neurobiol 25 : 1386-1403. - PubMed
    1. Barnea A, Cho G, Lu G, Mathis M ( 1995) Brain-derived neurotrophic factor induces functional expression and phenotypic differentiation of cultured fetal neuropeptide Y-producing neurons. J Neurosci Res 42 : 638-647. - PubMed

Publication types

MeSH terms