. 2003 Sep 10;23(23):8291-301.
doi: 10.1523/JNEUROSCI.23-23-08291.2003.

Activation of purinergic receptor subtypes modulates odor sensitivity

Affiliations

Activation of purinergic receptor subtypes modulates odor sensitivity

Colleen C Hegg et al. J Neurosci. .

Abstract

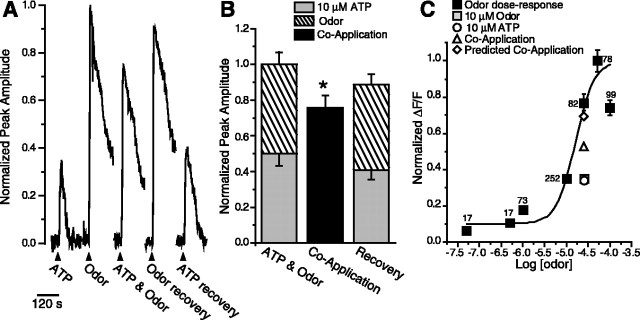
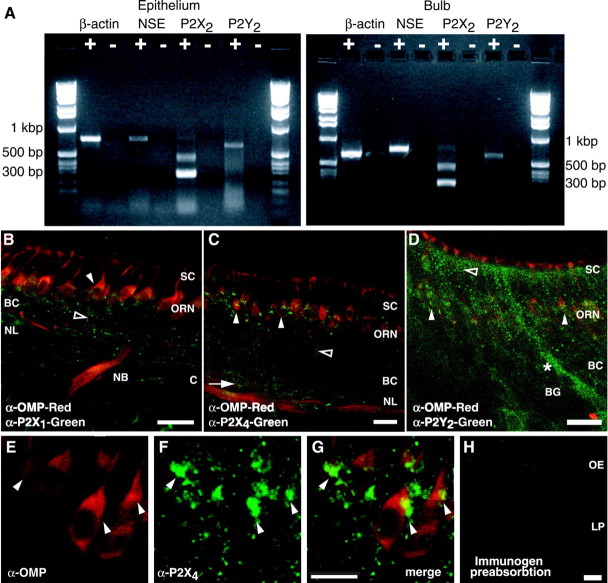
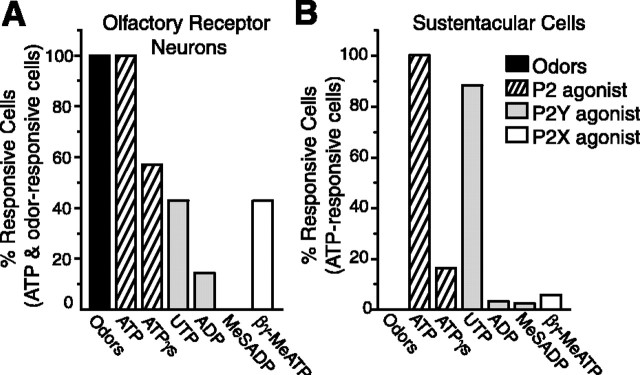
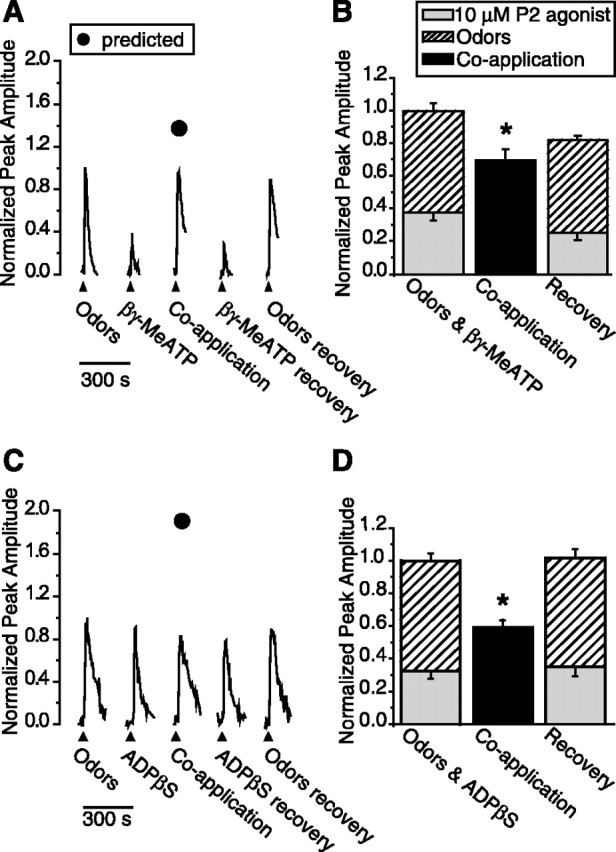
Purinergic nucleotides, including ATP and adenosine, are important neuromodulators of peripheral auditory and visual sensory systems (Thorne and Housley, 1996). ATP released by the olfactory epithelium (OE) after noxious stimuli provides a physiological source for a neuromodulatory substance independent of efferent innervation. Here we show that multiple subtypes of purinergic receptors are differentially expressed in olfactory receptor neurons and sustentacular support cells. Activation of purinergic receptors evoked inward currents and increases in intracellular calcium in cultured mouse olfactory receptor neurons. A mouse olfactory epithelial slice preparation and confocal imaging were used to measure changes in intracellular calcium in response to odors, purinergic receptor (P2R) agonists, or combined odor + P2R agonists. Pharmacological studies show that both P2Y and P2X receptor activation by exogenous and endogenous ATP significantly reduces odor responsiveness. Moreover, purinergic receptor antagonists increase the odor-evoked calcium transient, providing direct evidence that endogenous ATP modulates odor sensitivity via activation of multiple purinergic receptor subtypes in olfactory receptor neurons. Odor activation of G-protein-coupled receptors results in increased cAMP production, opening of cyclic nucleotide-gated channels, influx of Ca2+ and Na+, depolarization of the membrane, and activation of voltage- and Ca2+-gated ion channels. On-cell current-clamp recordings of olfactory receptor neurons from neonatal mouse slices revealed that ATP reduced cyclic nucleotide-induced electrical responses. These data also support the idea that ATP modulates odor sensitivity in mammalian olfactory neurons. Peripheral ATP-mediated odor suppression is a novel mechanism for reduced olfactory sensitivity during exposure to olfactotoxins and may be a novel neuroprotective mechanism.


Figures

Figure 8.
Figure 8.
ATP suppresses cyclic nucleotide-evoked membrane responses in OE slices. A, Representative EOG responses from OE slices attributable to Ringer's solution, odor, and a cyclic nucleotide mixture (100 μm IBMX, 50 μm CPT-cAMP, and 50 μm 8-Br-cGMP). Filled triangles correspond to the time of loop injection of the test solutions. B, Representative on-cell current-clamp recording from an ORN in an OE slice. Various test solutions were superfused onto the slice for 30 sec, indicated by the shaded region. The cell was allowed to recover for 7 min after each test application. Note that the coapplication of ATP (10 μm) and the mixture suppressed the evoked membrane potential changes. C, The electrical activity from each ORN was integrated from baseline, normalized to the initial cyclic nucleotide mixture response, and averaged (means + SEM). *p < 0.05, Newman-Keuls post hoc test. n = 3 ORNs from three slices, also indicated in each column.
Figure 5.
Figure 5.
ATP suppresses odor responses. A, Reduction of [Ca2+]i caused by the coapplication of ATP and odors compared with the summed response of ATP and odor. Shown are responses to 10 μm ATP, odor, coapplication of odor + ATP from a mouse ORN in a fluo-4-AM-loaded OE slice. Breaks in traces correspond to 5 min when images were not collected. B, Responses to individual application of ATP and odor were normalized to the sum of each response and averaged (stacked columns). The responses to the coapplication of ATP and odor were normalized to the summed individual responses and averaged (black columns). The recoveries, obtained after coapplication, were also normalized to the initial summed response. Bar graphs depict normalized peak Ca2+ transient amplitudes (means + SEM). n = 26 ORNs; *p = 0.001. C, Dose-response relationship for odor-evoked calcium transients measured in fluo-4-AM-loaded OE slices. Three concentrations of odor were superfused, in varying order, onto slices, and peak amplitudes were measured. Shown is the mean ± SEM; n is indicated next to each data point. Curve was fit by a Boltzmann function using Origin 6.0 software (Microcal Software, Northampton, MA). Note that data from B have been correlated to the odor dose-response relationship and plotted onto the dose-response relationship, slightly offset for clarity. For instance, because 10 μm odor is 0.35 U on the normalized odor dose-response relationship, the 10 μm odor from B is scaled to 0.35. The ATP response and the observed and predicted coapplication responses were also scaled appropriately.
Figure 1.
Figure 1.
Identification of purinergic receptors in the OE. A, RT-PCR analysis of P2X2 and P2Y2 mRNA in rat OE and bulb. The 643 bp product represents the P2Y2 isoform; the 499 bp product represents the P2X2-1 isoform, and the 292 bp product is the P2X2-2 isoform. Control β-actin (867 bp) and neuron-specific enolase (NSE; 753 bp) RT-PCR reactions are shown. +, Reverse-transcribed mRNA; -, omission of reverse transcriptase. B, C, Neonatal mouse OE showing punctate P2X1- and P2X4-IR (green) in OMP-positive (red) axons and ORNs (filled arrowheads) and in OMP-negative ORNs (open arrowheads) and basal cells (arrow). SC, Sustentacular cell layer; BC, basal cell layer; NL, nerve layer; C, cribriform plate; NB, nerve bundle. D, Neonatal mouse P2Y2 receptor-IR (green) occurs in ORNs (filled arrowheads), in the sustentacular cell layer (open arrowhead), and in a Bowman's gland (BG, *). E-G, High-power projection of P2X4-IR (green, F-G) on OMP-positive ORNs (red, E, G). Note the localization of P2X4-IR to the plasma membrane, particularly in the supranuclear region of the ORNs (filled arrowheads). The projection was created by stacking 20 confocal images taken every 1.32 μm in the z-axis direction. H, P2X1 receptor antibody preabsorption. LP, Lamina propria. Scale bars: A-D, H, 20 μm; E-G, 10 μm.
Figure 2.
Figure 2.
ATP evokes inward currents and increases intracellular Ca2+ in cultured mouse ORNs. A, Current responses to 10 μm ATP in two nystatin-patched ORNs held at -110 mV. Bottom trace shows the ATP stimulus profile recorded separately with an open electrode. Inset, Enlarged, compressed view of current from cell 1. B, Confocal images from fluo-4-AM-loaded ORNs taken before (left) and during (right) superfusion of 5 μm ATP. Scale bars, 50 μm. C, Representative fluorescence (F) increases from cell a in B in response to ATP (1-10 μm), Ringer's solution, 100 mm K+ Ringer's solution, and fluorescein (to show time course of solution delivery). D, Dose-response relationship for maximum % ΔF/F increases, relative to 10 μm ATP (mean ± SEM; n = 44 ORNs for each concentration). Curve was fitted by a Boltzmann equation, and the EC50 value of 1.4 μm was calculated by a nonlinear, least squares curve-fitting algorithm. Open square, Control 0 μm ATP (mean ± SEM). E, Representative traces from an ORN that responded to ATP (10 μm; arrowhead) in normal Ca2+and in 0 Ca2+ + EGTA (open bar).
Figure 3.
Figure 3.
Odor and purinergic receptor (P2R) agonists evoke increases in [Ca2+]i. See also supplementary information (available at http://medstat.med.utah.edu/physio/hegg/). A1-D4, Confocal images from a fluo-4-AM-loaded mouse OE slice during application of odors (10 μmn-amyl acetate + 10 μm r-carvone) (A), 10 μm ATP (B), 10 μm βγ-methylene ATP (βγ-MeATP) (C), or 10 μm UTP (D). Scale bar, 10 μm. A5-D5, Time course of odor- and P2R-agonist-evoked Ca2+ transients. Time points indicated by black triangles correspond to frame numbers in A1-D4. Representative odor-responsive ORNs are indicated by filled triangles (A1-A4; 6/11 ORNs marked) and as solid lines in A5. One odor-responsive ORN (filled triangle in B1-D4) and one SC (open triangle in B1-D4) are shown in the time course (B5-D5).
Figure 4.
Figure 4.
Frequency of response to purinergics in ORNs and sustentacular cells. Shown are the percentages of ATP-sensitive ORNs (A; identified by odor responsiveness; n = 14) and SCs (B; identified by location and lack of odor response; n = 122) that also had increases in [Ca2+]i evoked by nonselective purinergic receptor agonists (ATP, ATPγS), P2Y-selective agonists (UTP, ADP, MeSADP), and P2X-selective agonists (βγ-MeATP). The concentration for all purinergics was 10 μm.
Figure 6.
Figure 6.
Activation of specific purinergic receptor subtypes suppresses odor responses. A, C, Representative calcium transients in response to odor, 10 μm purinergic receptor (P2) agonists, or coapplication of odor + P2 agonists from individual mouse ORNs in fluo-4 AM-loaded OE slices. Filled triangles correspond to the time of loop injection of the odors or P2 agonists. Filled circles correspond to the predicted peak amplitude of coapplication (obtained by adding the control odor and P2 agonist values; refer to data analysis section for details). B, D, Responses to individual applications of P2 agonists and odor were normalized to the sum of each response and averaged (stacked columns). The responses to coapplication of P2 agonists and odor were normalized to the summed individual responses and averaged (black columns). The recoveries, obtained after coapplication, were also normalized to the initial summed response. Bar graphs depict normalized peak Ca2+ transient amplitudes (means + SEM). *p < 0.04, 0.001, respectively. A, B, Coapplication of P2X agonist (10 μm βγ-MeATP) and odor suppressed the calcium transient amplitude in 16 ORNs from six slices. C, D, Coapplication of P2Y agonist (10 μm ADPβS) and odor reduced the calcium transient amplitude in 15 ORNs from five slices.
Figure 7.
Figure 7.
Purinergic receptor antagonists potentiate odor-evoked calcium transients. A, B, Representative normalized calcium transients in response to odor in the absence (A) or presence (B) of P2 receptor antagonists (100 μm suramin + 25 μm PPADS) from individual mouse ORNs in fluo-4-AM-loaded OE slices. Filled triangles correspond to the time of loop injection of the odors. Slices were pretreated for 3 min with Ringer's solution or P2 receptor antagonists (open columns). C, Average peak calcium transient amplitudes are shown (means + SEM), as are the predicted peak amplitudes (filled circles) for the second application (n = 30 ORNs from seven slices for control and n = 22 ORNs from 12 slices for P2 receptor antagonists). The asterisk indicates a significant increase in [Ca2+]i in the observed compared with predicted (p = 0.024, paired Student's t test). D, Representative traces depicting basal fluorescence levels when bath is switched at 10 sec (open column) from Ringer's solution to either P2 receptor antagonists (solid lines) or Ringer's solution (dotted lines). The fluorometric signals shown are expressed as relative fluorescence change, ΔF/F = (F - F0)/F, where F0 is calculated from the linear rate of decay during the first 15 sec of the recording (F0 = mX + b). Thus, values of 0 represent no change in fluorescence and calcium levels, negative values represent decreases in calcium, and positive values represent increases in basal calcium levels.

Similar articles

Cited by

References

    1. Bodin P, Burnstock G ( 2001) Purinergic signalling: ATP release. Neurochem Res 26 : 959-969. - PubMed
    1. Brake AJ, Wagenbach MJ, Julius D ( 1994) New structural motif for ligand-gated ion channels defined by an ionotropic ATP receptor. Nature 371 : 519-523. - PubMed
    1. Brandle U, Spielmanns P, Osteroth R, Sim J, Surprenant A, Buell G, Ruppersberg JP, Plinkert PK, Zenner HP, Glowatzki E ( 1997) Desensitization of the P2X(2) receptor controlled by alternative splicing. FEBS Lett 404 : 294-298. - PubMed
    1. Buck L, Axel R ( 1991) A novel multigene family may encode odorant receptors: a molecular basis for odor recognition. Cell 65 : 175-187. - PubMed
    1. Burnstock G ( 1997) The past, present and future of purine nucleotides as signalling molecules. Neuropharmacology 36 : 1127-1139. - PubMed

Publication types

MeSH terms

LinkOut - more resources