

Effect of rifampicin on the pharmacokinetics and pharmacodynamics of nateglinide in healthy subjects
- PMID: 12968988
- PMCID: PMC1884366
- DOI: 10.1046/j.1365-2125.2003.01884.x
Effect of rifampicin on the pharmacokinetics and pharmacodynamics of nateglinide in healthy subjects
Abstract
Aims: Our aim was to investigate the effects of rifampicin on the pharmacokinetics and pharmacodynamics of nateglinide, a novel short-acting antidiabetic drug.
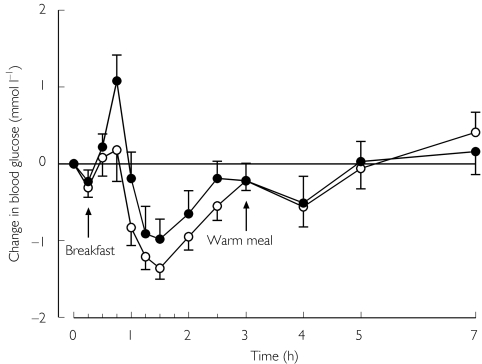
Methods: In a randomized crossover study with two phases, 10 healthy volunteers took 600 mg rifampicin or placebo orally once daily for 5 days. On day 6 of both phases, they ingested a single 60 mg dose of nateglinide. Plasma nateglinide and blood glucose concentrations were measured for up to 7 h postdose.
Results: Rifampicin decreased the mean AUC(0,7 h) of nateglinide by 24% (range 5-53%; P = 0.0009) and shortened its half-life (t(1/2)) from 1.6 to 1.3 h (P = 0.001). However, the peak plasma nateglinide concentration (Cmax) remained unchanged. The AUC(0,7 h) of the M7 metabolite of nateglinide was decreased by 19% (P = 0.002) and its t(1/2) was shortened from 2.1 to 1.6 h by rifampicin (P = 0.008). Rifampicin had no significant effect on the blood glucose-lowering effect of nateglinide.
Conclusions: Rifampicin modestly decreased the plasma concentrations of nateglinide probably by inducing its oxidative biotransformation. In some patients, rifampicin may reduce the blood glucose-lowering effect of nateglinide.
Figures


Similar articles
-
Effect of fluconazole on the pharmacokinetics and pharmacodynamics of nateglinide.Clin Pharmacol Ther. 2003 Jul;74(1):25-31. doi: 10.1016/S0009-9236(03)00089-4. Clin Pharmacol Ther. 2003. PMID: 12844132 Clinical Trial.
-
Coadministration of gemfibrozil and itraconazole has only a minor effect on the pharmacokinetics of the CYP2C9 and CYP3A4 substrate nateglinide.Br J Clin Pharmacol. 2005 Aug;60(2):208-17. doi: 10.1111/j.1365-2125.2005.02385.x. Br J Clin Pharmacol. 2005. PMID: 16042675 Free PMC article. Clinical Trial.
-
Effect of CYP2C9 and SLCO1B1 polymorphisms on the pharmacokinetics and pharmacodynamics of nateglinide in healthy Chinese male volunteers.Eur J Clin Pharmacol. 2013 Mar;69(3):407-13. doi: 10.1007/s00228-012-1364-9. Epub 2012 Jul 28. Eur J Clin Pharmacol. 2013. PMID: 22842957 Clinical Trial.
-
Drug-drug and food-drug pharmacokinetic interactions with new insulinotropic agents repaglinide and nateglinide.Clin Pharmacokinet. 2007;46(2):93-108. doi: 10.2165/00003088-200746020-00001. Clin Pharmacokinet. 2007. PMID: 17253883 Review.
-
Clinical pharmacokinetics of nateglinide: a rapidly-absorbed, short-acting insulinotropic agent.Clin Pharmacokinet. 2004;43(2):97-120. doi: 10.2165/00003088-200443020-00003. Clin Pharmacokinet. 2004. PMID: 14748619 Review.
Cited by
-
Drug interactions of meglitinide antidiabetics involving CYP enzymes and OATP1B1 transporter.Ther Adv Endocrinol Metab. 2018 Apr 6;9(8):259-268. doi: 10.1177/2042018818767220. eCollection 2018. Ther Adv Endocrinol Metab. 2018. PMID: 30181852 Free PMC article. Review.
-
Effects of rifampicin on the pharmacokinetics of roflumilast and roflumilast N-oxide in healthy subjects.Br J Clin Pharmacol. 2009 Oct;68(4):580-7. doi: 10.1111/j.1365-2125.2009.03478.x. Br J Clin Pharmacol. 2009. PMID: 19843061 Free PMC article.
-
Tuberculosis and diabetes mellitus: convergence of two epidemics.Lancet Infect Dis. 2009 Dec;9(12):737-46. doi: 10.1016/S1473-3099(09)70282-8. Lancet Infect Dis. 2009. PMID: 19926034 Free PMC article. Review.
-
Drug Interactions of Clinical Importance with Antihyperglycaemic Agents : An Update.Drug Saf. 2005 Jul;28(7):601-631. doi: 10.2165/00002018-200528070-00004. Drug Saf. 2005. PMID: 27722966 Review.
-
Hit Generation in TB Drug Discovery: From Genome to Granuloma.Chem Rev. 2018 Feb 28;118(4):1887-1916. doi: 10.1021/acs.chemrev.7b00602. Epub 2018 Jan 31. Chem Rev. 2018. PMID: 29384369 Free PMC article. Review.
References
-
- Dornhorst A. Insulinotropic meglitinide analogues. Lancet. 2001;358:1709–1716. - PubMed
-
- Weaver ML, Orwig BA, Rodriguez LC, et al. Pharmacokinetics and metabolism of nateglinide in humans. Drug Metab Dispos. 2001;29:415–421. - PubMed
-
- Dunn CJ, Faulds D. Nateglinide. Drugs. 2000;60:607–615. - PubMed
-
- Wienkers LC, Wurden CJ, Storch E, Kunze KL, Rettie AE, Trager WF. Formation of (R) -8-hydroxywarfarin in human liver microsomes. A new metabolic marker for the (S) -mephenytoin hydroxylase, P4502C19. Drug Metab Dispos. 1996;24:610–614. - PubMed
Publication types
MeSH terms
Substances
LinkOut - more resources
Full Text Sources
Medical
