. 2003 Sep 15;22(18):4856-65.
doi: 10.1093/emboj/cdg453.

A novel sensor of NADH/NAD+ redox poise in Streptomyces coelicolor A3(2)

Affiliations

A novel sensor of NADH/NAD+ redox poise in Streptomyces coelicolor A3(2)

Dimitris Brekasis et al. EMBO J. .

Abstract

We describe the identification of Rex, a novel redox-sensing repressor that appears to be widespread among Gram-positive bacteria. In Streptomyces coelicolor Rex binds to operator (ROP) sites located upstream of several respiratory genes, including the cydABCD and rex-hemACD operons. The DNA-binding activity of Rex appears to be controlled by the redox poise of the NADH/NAD+ pool. Using electromobility shift and surface plasmon resonance assays we show that NADH, but not NAD+, inhibits the DNA-binding activity of Rex. However, NAD+ competes with NADH for Rex binding, allowing Rex to sense redox poise over a range of NAD(H) concentrations. Rex is predicted to include a pyridine nucleotide-binding domain (Rossmann fold), and residues that might play key structural and nucleotide binding roles are highly conserved. In support of this, the central glycine in the signature motif (GlyXGlyXXGly) is shown to be essential for redox sensing. Rex homologues exist in most Gram-positive bacteria, including human pathogens such as Staphylococcus aureus, Listeria monocytogenes and Streptococcus pneumoniae.


Figures

None
Fig. 1. Transcriptional analysis of the S.coelicolor cyd operon using S1 nuclease mapping. Strains were grown to mid-late exponential phase prior to oxygen limitation, or the addition of respiratory inhibitors, ZnCl2 (0.5 mM) or KCN (5 mM), as indicated. RNA was isolated at the indicated time points. Arrows indicate the protected DNA fragments that correspond to the 5′ end of transcripts that initiate at cydP1 and cydP2. Whereas cydP2 remains relatively constant, cydP1 is induced by oxygen limitation, zinc treatment and cyanide treatment. The position of marker fragments from a HpaII digestion of pBR322 are indicated for oxygen limitation.
None
Fig. 2. Mutational analysis of the cydP1 promoter and the identification of a repressor binding site (ROP). (A) The non-template strand of the cydP1 promoter is indicated, together with the location of the cydP1 transcript 5′ end. DNA replaced by the BamHI restriction site in each of the mutations, M1–M13, is underlined. The activity of each promoter, as judged by the level of kanamycin resistance conferred on S.coelicolor when fused to neo in pIJ487, is indicated: –, no detectable activity; +, 2–3 µg/ml; +++, 10–12 µg/ml. The wild-type promoter conferred resistance to 2–3 µg/ml kanamycin. An inverted repeat (ROP), believed to be a repressor binding site is marked by inverted arrows. A putative overlapping half-site is also marked by an arrow. The non-template sequence corresponding to the region of the template strand protected from DNase I by the ROP-binding protein Rex (see Figure 4) is shaded in grey. (B) EMSA using a 168 bp cydP1 fragment as probe and crude extract prepared from S.coelicolor M600. Assays were conducted in the absence (lanes 1 and 2) or presence (lanes 3 and 4) of 1000-fold molar excess of non-homologous herring sperm DNA. The open arrow indicates unbound probe and the closed arrows indicate protein–DNA complexes. (C) Alignment of ROP-related sites located upstream from the cydABCD (cyd), SCO3320-hemACD (SCO3320), and nuoA-N (nuo) operons. The distance from the ROP site to the translation start codon of the first gene of each operon is indicated.
None
Fig. 3. Evidence that SCO3320 encodes Rex, the ROP-binding repressor. (A) Transcriptional analysis of cydP1 and the SCO3320-hem operon promoter in M600 (wild type) and S105SUP1 (ΔSCO3320::apr) using S1 nuclease mapping (see Figure 1 for details). (B) EMSAs were performed using the SCO3320-hem operon promoter region as a probe. Lane 1 contains no added extract and 1anes 2–4 contain crude extracts prepared from M600, S105SUP1 or S105SUP1 (pSET152::SCO3320), respectively. (C) EMSAs using promoter fragments that include the ROP sites located upstream of the cyd, SCO3320-hem and nuo operons (1 nM each), mixed with purified SCO3320 (Rex) protein (25 or 100 nM). The open arrow indicates unbound probe and the closed arrows indicate protein–DNA complexes.
None
Fig. 4. Binding of Rex to cydP1. (A) DNase I footprinting of the Rex–cydP1 complex. The 360 bp cydP1 fragment was 5′ end-labelled on the bottom (template) strand and mixed with increasing concentrations of Rex, prior to DNase I treatment, as follows: lane 3, no added Rex; lane 4, 1 nM; lane 5, 5 nM; lane 6, 10 nM; lane 7, 25 nM; lane 8, 50 nM. Lanes 1–2, A and G dideoxynucleotide sequencing reactions. The extent of the interaction between Rex and cydP1, with respect to the transcription initiation site, is indicated by a vertical grey bar (see Figure 2A for sequence). (B) EMSAs using cydP1 mutant promoter fragments (see Figure 2A) and purified Rex. Only the upstream ROP half-site is disrupted in cydP1-M11, both half-site and complete ROP site are disrupted in cydP1-M12, and only the complete ROP site is disrupted in cydP1-M13. Each assay contained 1 nM promoter DNA and 25 or 200 nM Rex. The open arrow indicates unbound probe and the closed arrows indicate Rex–DNA complexes.
None
Fig. 5. Alignment of Rex-related proteins from Gram-positive bacteria using Clustal_W. The proteins are also aligned with rat biliverdin reductase (BVR) as predicted by sequence-structure comparisons using FUGUE (Shi et al., 2001). Identical residues are highlighted in black, and similar residues are outlined in grey. The secondary structure of the pyridine nucleotide-binding domain (Rossmann fold) of BVR, as determined from the crystal structure (Kikuchi et al., 2001), is indicated by black lines (helices) or arrows (strands). A secondary structure prediction of Rex, determined using PSIPRED (McGuffin et al., 2000), is indicated by grey lines (helices) or arrows (strands). A putative HTH motif in Rex is marked with dotted arrows. A conserved glycine-rich signature motif (Gly100XGly102XXGly105 in S.coelicolor) that is found in most NAD+-dependent dehydrogenases is indicated by asterisks. Also indicated is an aspartate (Asp126 in S.coelicolor) that might play a role in discriminating between NAD(H) and NADP(H). The amino acid sequence data was obtained from the SwissProt database. Sco, S.coelicolor (Q9WX14); Lmo, L.monocytogenes (Q929U6); Bsu, B.subtilis (O05521); Sau, S.aureus (Q99SK6). The non-conserved C-terminal 20 residues of S.coelicolor Rex are not included.
None
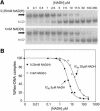
Fig. 6. The DNA-binding activity of Rex is inhibited by NADH. (A) EMSAs were performed using a rex (SCO3320) promoter fragment as probe (1 nM), purified Rex (35 nM) and 0.1 or 1 mM pyridine nucleotides, as indicated. The open arrow indicates unbound probe and the closed arrows indicate the Rex–DNA complex. –, no added Rex. (B) EMSAs were performed as in (A) but using RexG102A in which the central glycine in the GlyXGlyXXGly Rossmann fold fingerprint was changed to alanine. (C) EMSAs were performed as in (A) but with 50 nM Rex and a range of NADH concentrations, as indicated. (D) The data from (C) were quantified by phosphoimage analysis and plotted as % Rex–DNA complex versus NADH concentration. Values were normalized to 0 µM NADH (100% Rex–DNA complex). The concentration of NADH required to generate an ∼50% loss of the Rex–DNA complex (IC50) was determined from the best-fit curve.
None
Fig. 7. NADH, but not NAD+, actively dissociates a Rex–ROP complex. SPR experiments were carried out at 25°C using HSB-T as running buffer and a flow rate of 20 µl/min. Sensorgrams were obtained by the subtraction of background values obtained from a DNA-free flow cell from the raw interaction data, then overlayed. The streptavidin sensor chip was charged with a 37 bp double stranded biotinylated oligonucleotide including the ROPnuo site. (A) Rex (SCO3320) was injected to give a response unit shift of ∼200 RU. (B) End of Rex injection. (C) NAD+ or NADH, at the concentrations indicated, were injected and the dissociation of the complex monitored over time.
None
Fig. 8. Rex DNA-binding activity is modulated by NADH/NAD+ redox poise. (A) EMSAs were performed using a rex (SCO3320) promoter fragment as probe (1 nM) and purified Rex (50 nM). Each assay contained NADH at the concentration indicated, balanced with the appropriate level of NAD+ to give final co-factor concentrations of either 0.25 or 1 mM. Open arrows indicate unbound probe and closed arrows indicate Rex–DNA complexes. (B) The data from (A) was quantified by phosphoimage analysis and plotted as percentage Rex–DNA complex versus NADH concentration. Values were normalized to 0 µM NADH (100% Rex–DNA complex). For each experiment, the concentration of NADH required to generate an ∼50% loss of the Rex–DNA complex (IC50) was determined from the best-fit curve.

Similar articles

Cited by

References

    1. Baker P.J., Britton,K.L., Rice,D.W., Rob,A. and Stillman,T.J. (1992) Structural consequences of sequence patterns in the fingerprint region of the nucleotide binding fold. Implications for nucleotide specificity. J. Mol. Biol., 228, 662–671. - PubMed
    1. Bateman A. et al. (2000) The Pfam protein families database. Nucleic Acids Res., 30, 276–280. - PMC - PubMed
    1. Becker S., Holighaus,G., Gabrielczyk,T. and Unden,G. (1996) O2 as the regulatory signal for FNR-dependent gene regulation in Escherichia coli. J. Bacteriol., 178, 4515–4521. - PMC - PubMed
    1. Bentley S.D. et al. (2002) Complete genome sequence of the model actinomycete Streptomyces coelicolor A3(2) Nature, 417, 141–147. - PubMed
    1. Bierman M., Logan,R., O’Brien,K., Seno,E.T., Rao,R.N. and Schoner,B.E. (1992) Plasmid cloning vectors for the conjugal transfer of DNA from Escherichia coli to Streptomyces spp. Gene, 116, 43–49. - PubMed

Publication types

MeSH terms